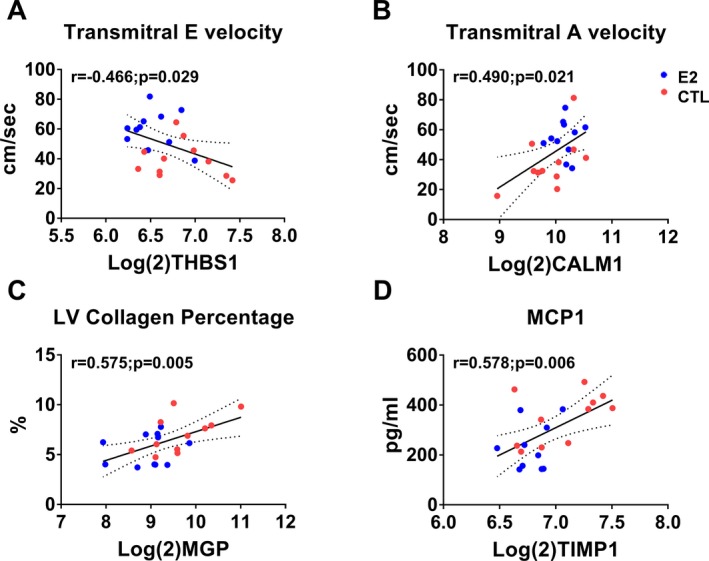
Figure 6.

Scatterplots of expression levels of differentially expressed genes (DEGs) and echocardiographic and biomolecular phenotypes in estradiol and control (CTL) animals. Thrombospondin 1 (THBS1) negatively correlated with transmitral E velocity (A), Calmodulin 1 (CALM1) positively correlated with transmitral A velocity (B), matrix Gla protein (MGP) correlated positively with left ventricular collagen percentage (C), and TIMP metallopeptidase inhibitor 1 (TIMP1) correlated positively with monocyte chemoattractant protein 1 (MCP1) (D). Red symbols=control; blue symbols=estradiol treated.
