
Figure 7.
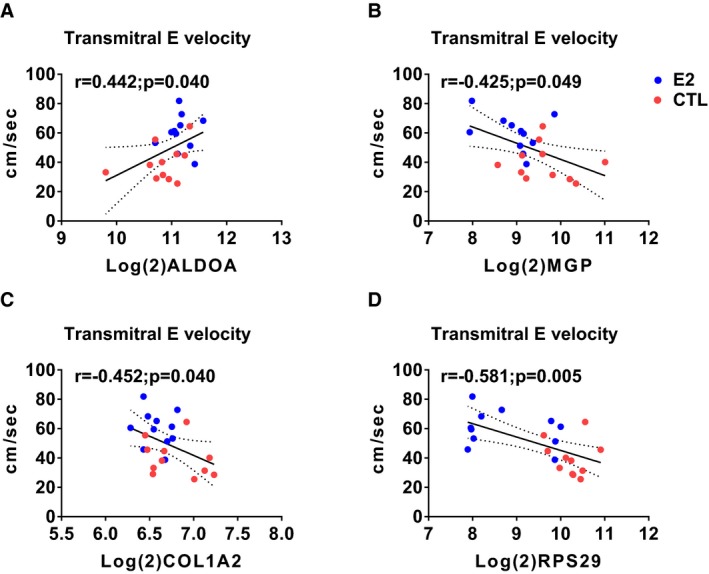
Scatterplots of expression levels of differently expressed genes (DEGs) and transmitral E velocity. Aldolase A, fructose‐bisphosphate (ALDOA) positively correlated with transmitral E velocity (A) whereas matrix Gla protein (MGP), collagen, type I, α2 (COL1A2), and ribosomal protein subunit 29 (RPS29) correlated negatively (B through D, respectively). Red symbols=control; blue symbols=estradiol treated.