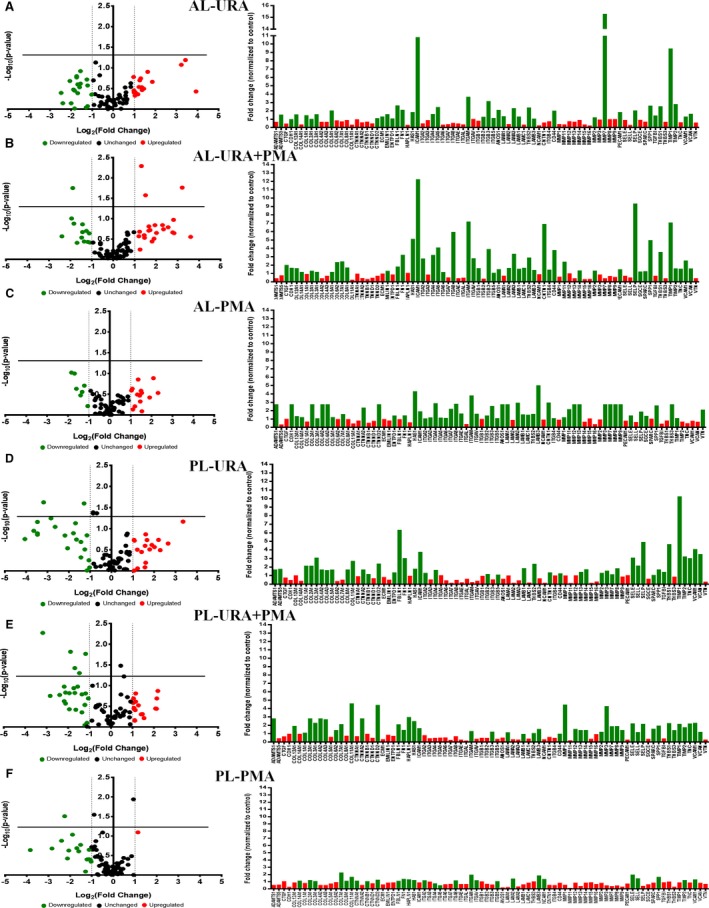
Figure 4.

Gene expression studies in tissue from the anterior and posterior leaflets explanted from pigs from each experimental group, when compared with data from the sham group of animals. A through C, Differential fold change of expression of different genes in each experimental group compared with the sham group of animals in the anterior leaflet, with the significantly upregulated genes (indicated in green) and significantly downregulated genes (indicated in red) in the bar graphs. D through F, Differential expression of specific extracellular matrix and fibrosis genes between the different repairs when normalized to the sham group, with upregulated in green and downregulated in red in the bar graphs. AL indicates anterior leaflet; PL, posterior leaflet; PMA, papillary muscle approximation; URA, undersized ring annuloplasty.
