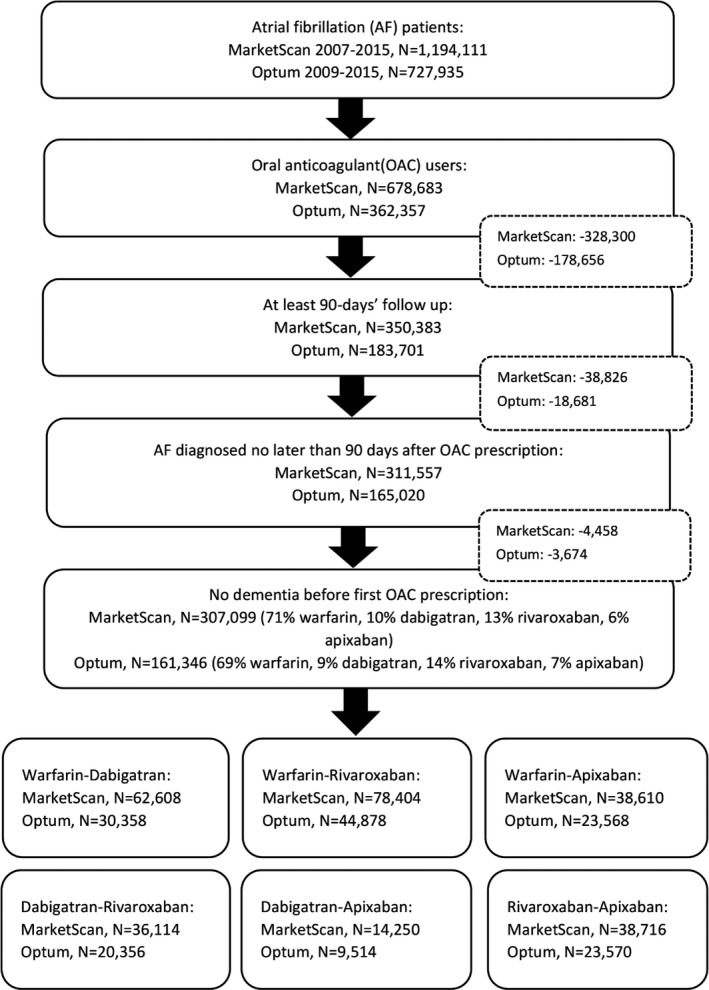
Figure 1.

Flow chart of enrollees’ selection to final analysis sample. Inclusion criteria were applied to the MarketScan and Optum databases, and all the eligible enrollees were matched 1:1 on propensity score to generate 6 final head‐to‐head oral anticoagulant (OAC) comparison cohorts. AF indicates atrial fibrillation.
