
Figure 5.
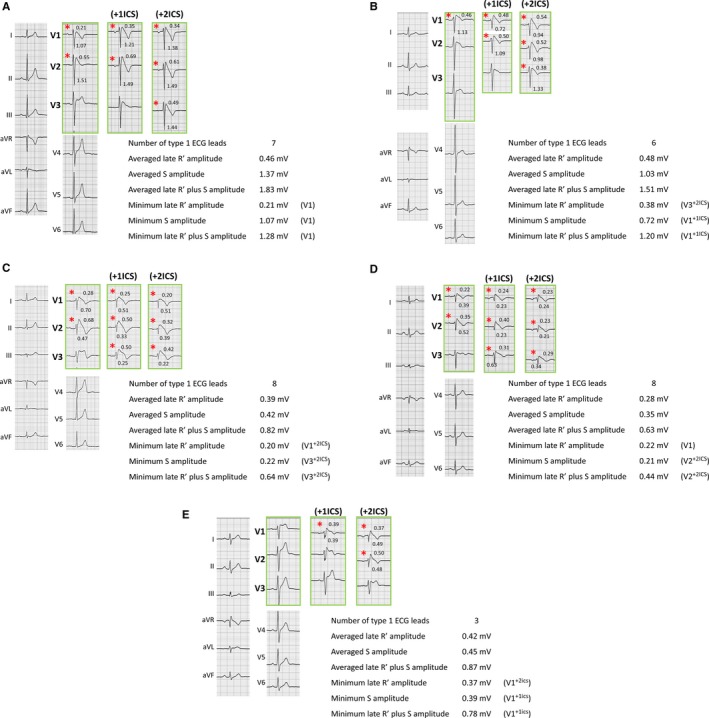
Representative cases. Representative cases of ECGs, including the 9 right precordial leads (green frame) and evaluated data in this study. Red asterisks indicate type 1 ECG. Numerical values on the ECG show the amplitude of later R′ (top panels) and S (bottom panels) in each ECG showing type 1. A, A 31‐year‐old male patient without any symptoms (group AS). This patient was free from all symptoms during follow‐up. Minimum late R′, minimum S, and minimum late R′ plus S were recorded in lead V1. B, A 66‐year‐old male patient with a previous syncope episode (group SY). This patient was free from all symptoms during follow‐up. Minimum late R′ was recorded in lead V3 with upper 2 intercostal spaces (+2ICS), and minimum S and minimum late R′ plus S were recorded in lead V1 with upper 1 intercostal space (+1ICS). C, A 52‐year‐old male group AS patient. In this patient, a ventricular fibrillation episode was observed during follow‐up. Minimum late R′ was recorded in lead V1+2 ICS, and minimum S and minimum late R′ plus S were recorded in lead V3+2 ICS. D, A 51‐year‐old male group SY patient. In this patient, a ventricular fibrillation episode was observed during follow‐up. Minimum late R′ was recorded in lead V1, and minimum S and minimum late R′ plus S were recorded in lead V2+2 ICS. E, A 42‐year‐old male patients with documented ventricular fibrillation. In this patient, a recurrent ventricular fibrillation episode was observed during follow‐up. Minimum late R′ was recorded in lead V1+2ICS, and minimum S and minimum late R′ plus S were recorded in lead V1+1ICS.