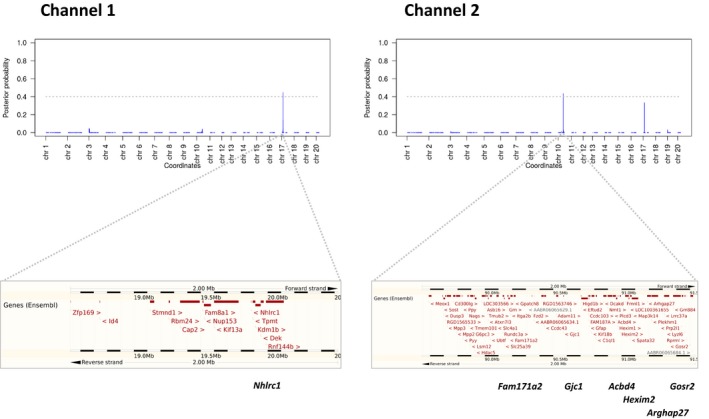
Figure 1.

PR loci on chromosome 10 and chromosome 17. (top) Manhattan plots of association with PR interval as measured in channel 1 (left figure) and channel 2 (right figure). On the y‐axis is the Marginal Posterior Probability of Inclusion as determined using the sparse Bayesian modeling of the ESS software. The stronger the association, the higher the value. On the x‐axis are the genome coordinates of the interrogated markers. The gray dotted line signifies the 5% false discovery rate cut‐off value, determined by permutation analysis. Two loci were identified on chromosome 17 and chromosome 10 for PR interval in channel 1 and channel 2, respectively. Bottom: overview of the genes at the identified loci (source: Ensembl). Below each figure in bold are several genes discussed in detail within the article.
