
Figure 2.
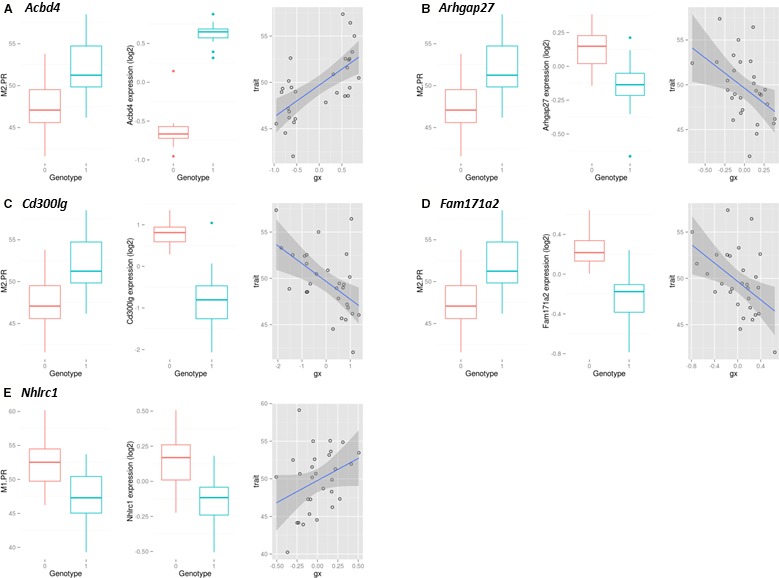
Genes with significant eQTL at chromosome 10 and 17 PR interval associated loci. For each gene (A: Acbd4, B: Arhgap27, C: Cd300lg, D: Fam171a2 and E: Nhlrc1), from left to right: (1) Boxplots of PR interval duration for the SHR allele (genotype “0”) and BN allele (genotype “1”); (2) Boxplots of gene expression data for the SHR allele (genotype “0”) and BN allele (genotype “1”); (3) Scatterplot of gene expression vs PR interval duration, with the blue line a linear least‐squares fit and the underlying gray shading the estimated error. Gene expression data were corrected for the first principal component; expression levels are relative. BN indicates Brown Norway rat; eQTL, expression quantitative trait locus; SHR, spontaneously hypertensive rat.