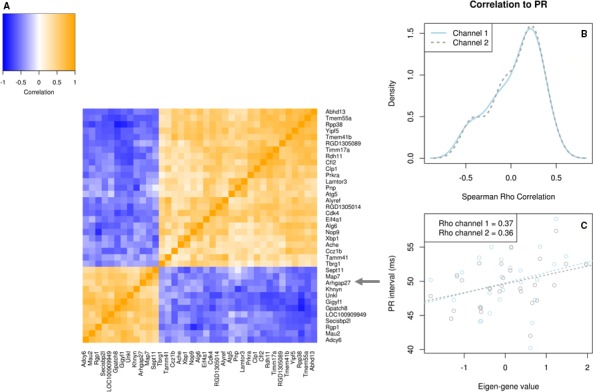
Figure 4.

Co‐expression network containing significant eQTL gene Arhgap27. Overview of the co‐expression network of 37 genes, containing a candidate gene identified through eQTL analysis. A, Heatmap showing the Spearman correlation between gene expression patterns of each gene pair. Blue signifies negative correlation, while orange signifies positive correlation. The candidate gene, Arhgap27, is highlighted by gray arrows. B, Density distribution plot of the Spearman correlation values for each gene in the network with PR interval in channel 1 (solid line) and channel 2 (dashed line). This figure summarizes the correlation of the network with PR interval on gene level. C, Scatterplot of the network eigengene values vs PR interval. Dotted lines represent the linear least‐squares fits for channel 1 (light blue) and channel 2 (gray). Spearman Rho correlation values are given in the legend for each channel. This figure summarizes the correlation of the network with PR on network level. eQTL indicates expression quantitative trait locus.
