
Figure 1.
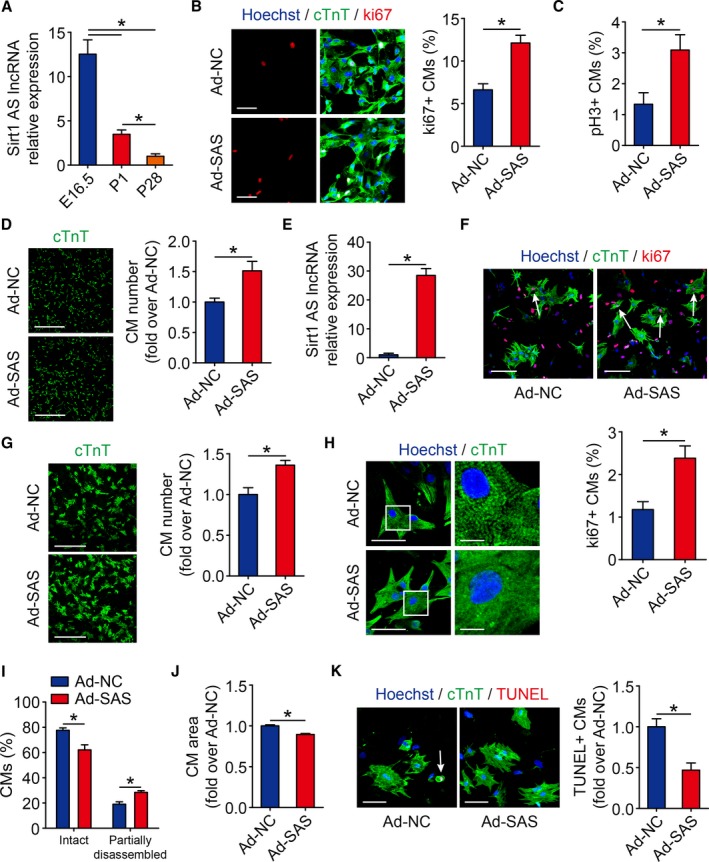
fesbSirt1 antisense (AS) long noncoding RNA (lncRNA) induces cardiomyocyte (CM) proliferation in neonatal mice. A, Real‐time quantitative PCR (qPCR) results of Sirt1 AS lncRNA between embryonic day 16.5 (E16.5), postnatal day 1 (P1), and postnatal day 18 (P28) mice hearts (n=6 mice per group). B, Isolated P1 CMs transfected with adenovirus‐control (Ad‐NC) or Ad–Sirt1 AS lncRNA (SAS) were immunostained for ki67 and quantification of ki67‐positive CMs (652 CMs from 4 mice in Ad‐NC group, 857 CMs from 4 mice in Ad‐SAS group). Bar=50 μm. C, Quantification of pH3‐positive CMs in isolated P1 CMs transfected with Ad‐NC or Ad‐SAS (440 CMs from 4 mice in Ad‐NC group, 678 CMs from 4 mice in Ad‐SAS group). Bar=30 μm. D, Immunofluorescence of cTnT and quantification of the counts of P1 CMs transfected with Ad‐NC or Ad‐SAS (n=3 mice per group). Bar=500 μm. E, Real‐time qPCR results of Sirt1 AS lncRNA level in isolated P7 CMs transfected with Ad‐NC and Ad‐SAS (n=3 mice per group). F, P7 CMs transfected with Ad‐NC or Ad‐SAS were immunostained for ki67 and quantification of ki67‐positive CMs (419 CMs from 4 mice in Ad‐NC group, 421 CMs from 4 mice in Ad‐SAS group). Ki67‐positive CMs were indicated by arrows. Bar=100 μm. G, Immunofluorescence of cTnT and quantification of the counts of P7 CMs transfected with Ad‐NC or Ad‐SAS (n=3 mice per group). Bar=500 μm. H, Immunofluorescence of cTnT and Hoechst 33 342 and quantification of the CM area and CM sarcomeric status in isolated P7 CMs transfected with Ad‐NC or Ad‐SAS. Bars: 50 μm (left panels); 10 μm (right panels). I, Quantification of CM sarcomeric status in isolated P7 CMs transfected with Ad‐NC or Ad‐SAS (713 CMs from 3 mice in Ad‐NC group, 752 CMs from 3 mice in Ad‐SAS group). J, Quantification of CM area in isolated P7 CMs transfected with Ad‐NC or Ad‐SAS (90 CMs from 3 mice in Ad‐NC group, 103 CMs from 3 mice in Ad‐SAS group). K, Cell apoptosis was detected by terminal deoxynucleotidyl transferase–mediated dUTP nick end labeling (TUNEL) staining in Ad‐NC– and Ad‐SAS–transfected isolated P1 CMs and quantitative analysis of TUNEL‐positive CMs (727 CMs from 3 mice in Ad‐NC group, 764 CMs from 3 mice in Ad‐SAS group). TUNEL‐positive CMs were indicated by arrows. Bar=50 μm. Statistical significance was calculated using 1‐way ANOVA, followed by least significant difference post hoc test in A and 2‐tailed unpaired Student t test in B through G and I through K. Data represent mean±SEM. *P<0.05.