
Figure 6.
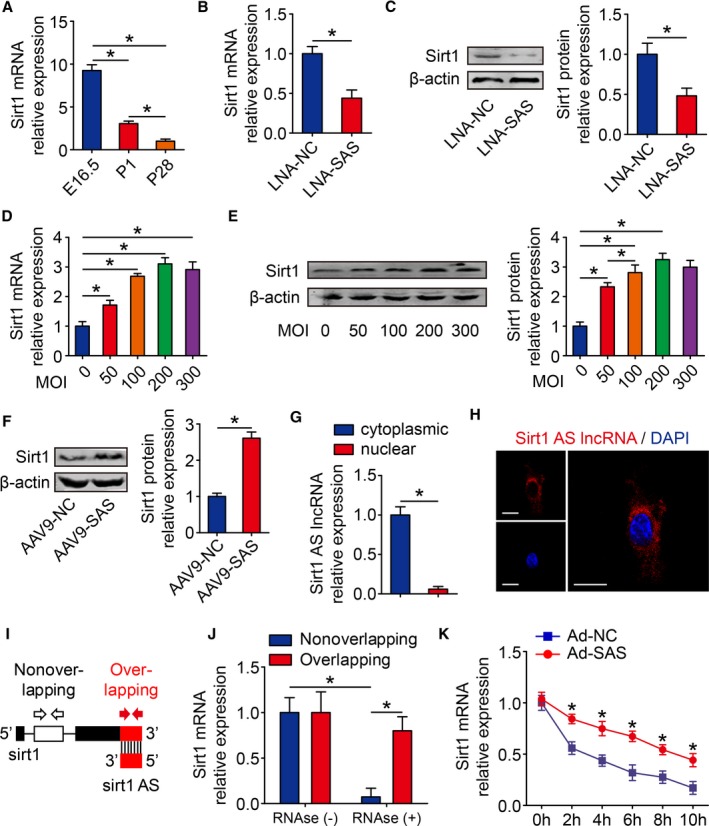
Sirt1 antisense (AS) long noncoding RNA (lncRNA) increases stability of Sirt1 mRNA. A, Real‐time quantitative PCR (qPCR) analysis of Sirt1 mRNA levels in embryonic day 16.5 (E16.5), postnatal day 1 (P1), and postnatal day 28 (P28) mouse hearts (n=6 mice per group). B, Real‐time qPCR analysis of Sirt1 mRNA levels in isolated cardiomyocytes (CMs) transfected with locked nucleic acid–control (LNA‐NC) or LNA–Sirt1 AS lncRNA (SAS) (n=3 mice per group). C, Western blotting analysis and quantitative analyses of Sirt1 protein levels in isolated CMs transfected with LNA‐NC or LNA‐SAS. β‐Actin was used as a loading control (n=3 mice per group). D, Real‐time qPCR analysis of Sirt1 mRNA levels in isolated CMs transfected with various multiplicities of infection (MOIs) of adenovirus (Ad)–SAS (n=3 mice per group). E, Western blotting analysis and quantitative analyses of Sirt1 protein levels in isolated CMs transfected with various MOIs of Ad‐SAS. β‐Actin was used as a loading control (n=3 mice per group). F, Western blotting analysis and quantitative analyses of Sirt1 protein levels in adeno‐associated virus 9 (AAV9)–NC– or AAV9‐SAS–injected adult mice hearts 28 days after injection. β‐Actin was used as a loading control (n=6 mice per group). G, Real‐time qPCR of cytoplasmic and nuclear fractions to detect Sirt1 AS lncRNA expression in isolated CMs (n=3 mice per group). H, RNA fluorescence in situ hybridization assay of Sirt1 AS lncRNA immunofluorescence detection in isolated CMs. Bar=20 μm. I, Nonoverlapping and overlapping primer positions for ribonuclease protection assay (RPA). J, RPA performed on RNA samples from isolated CMs (n=3 mice per group). K, RNA stability assay of Sirt1 mRNA expression in isolated CMs transfected with Ad‐NC or Ad‐SAS (n=3 mice per group). Statistical significance was calculated using 1‐way ANOVA followed by least significant difference post hoc test in A, D, E, J, and K, and 2‐tailed unpaired Student t test in B, C, F, and G. Data represent mean±SEM. DAPI indicates 4’,6‐diamidino‐2‐phenylindole. *P<0.05.