Figure 2.

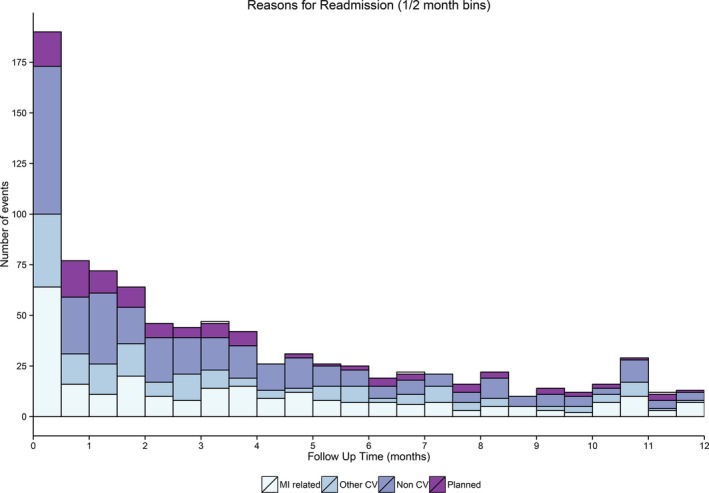
Frequency staked bar graph depicting the change in the number of readmissions after myocardial infarction (MI) for different reasons over 0.5‐month follow‐up time frames. CV indicates cardiovascular.

Frequency staked bar graph depicting the change in the number of readmissions after myocardial infarction (MI) for different reasons over 0.5‐month follow‐up time frames. CV indicates cardiovascular.