
Figure 4.
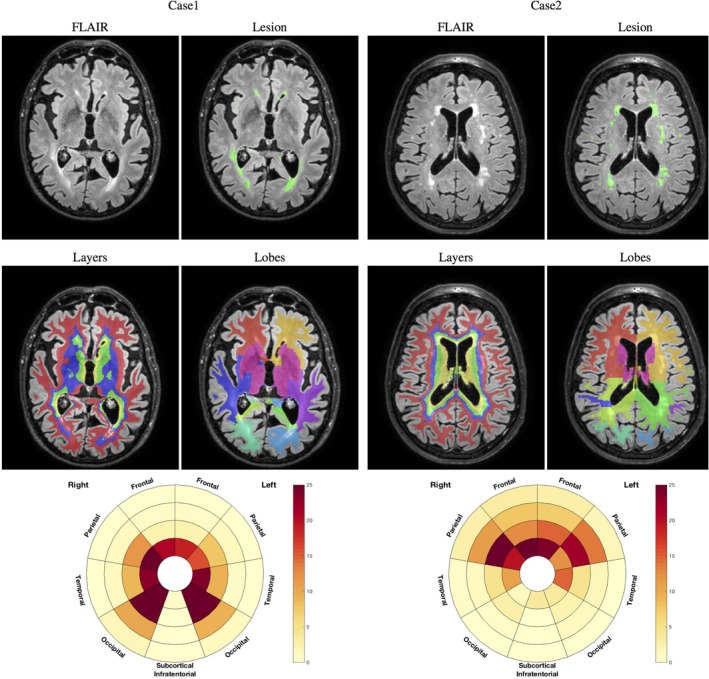
Example of 2 cases with original FLAIR image and lesion segmentation (first row), layers and lobar separation (second row), and resulting bullseyes plot. The color indicates the percentage of a given region to be occupied by WMH. The angular segment represents the different lobes while concentric layers indicate distance layers from the ventricular surface, distance increasing with the radius. Example of 2 cases with original FLAIR image and lesion segmentation (first row), layers and lobar separation (second row), and resulting bullseyes plot. The color indicates the percentage of a given region to be occupied by WMH. The angular segment represents the different lobes while concentric layers indicate distance layers from the ventricular surface, with distance increasing with the radius. FLAIR indicates Fluid Attenuated Inversion Recovery; WMH, white matter hyperintensities.