Figure 1.

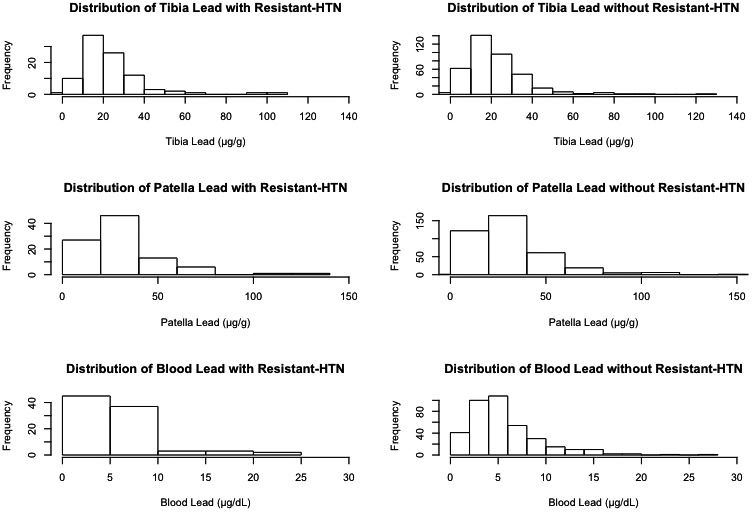
Histogram of lead by source. Distribution of tibia, patella, and blood lead levels by resistant hypertension (HTN) status, as seen left to right.

Histogram of lead by source. Distribution of tibia, patella, and blood lead levels by resistant hypertension (HTN) status, as seen left to right.