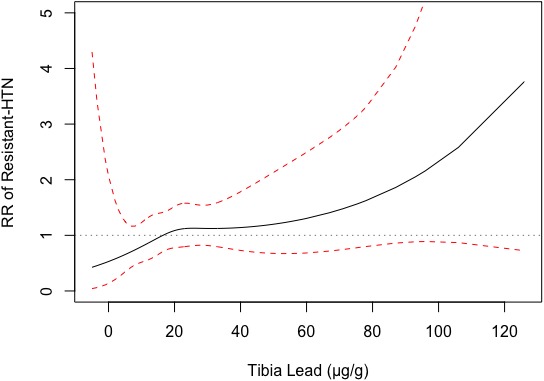
Figure 2.

Dose‐response curve of tibia lead level and resistant hypertension (HTN) risk. Dose‐response plot demonstrating observed tibia lead levels when compared with change in relative risk of resistant hypertension outcome utilizing the final adjusted model. Red dashed lines indicate 95% confidence interval. Grey dotted line indicates relative risk of 1.
