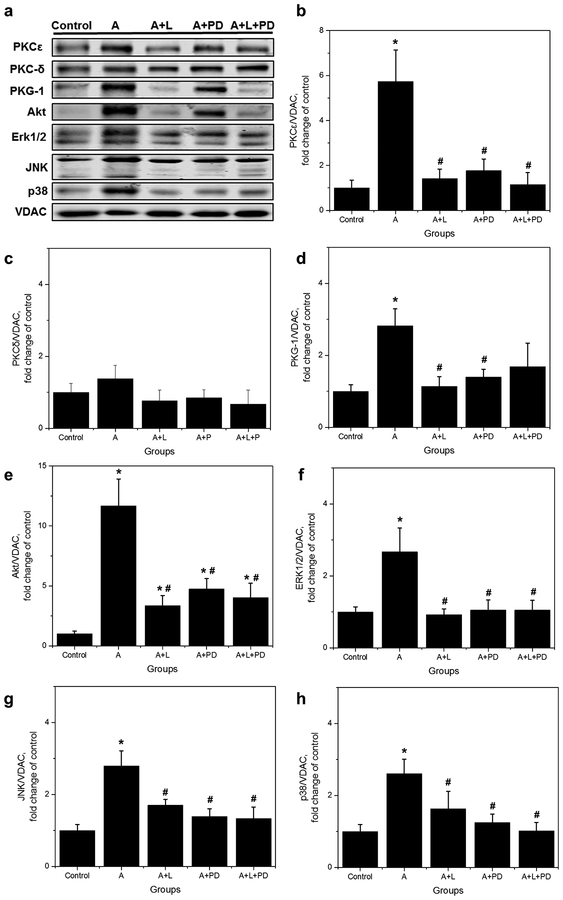
Fig. 5.
Effect of losartan and PD in protein levels of PKCε, PKCδ, PKG-1, Akt, ERK1/2, JNK, and p38 in isolated mitochondria. (a), Representative Western blots and quantitative data of total (b), PKCɛ; (c), PKCδ; (d), PKG-1; (e), Akt; (f), ERK1/2; (g), JNK; (h), p38. Proteins were calculated as the ratio of total protein to VDAC and normalized to control for each kinase. The values are shown as means ± SEM of five experiments per group, except A+L+PD (n=4). *p<0.05 vs Control; #p<0.05 vs A. A = APC, A+L = APC+losartan; A+PD = APC+PD; A+L+PD = APC+losartan+PD

