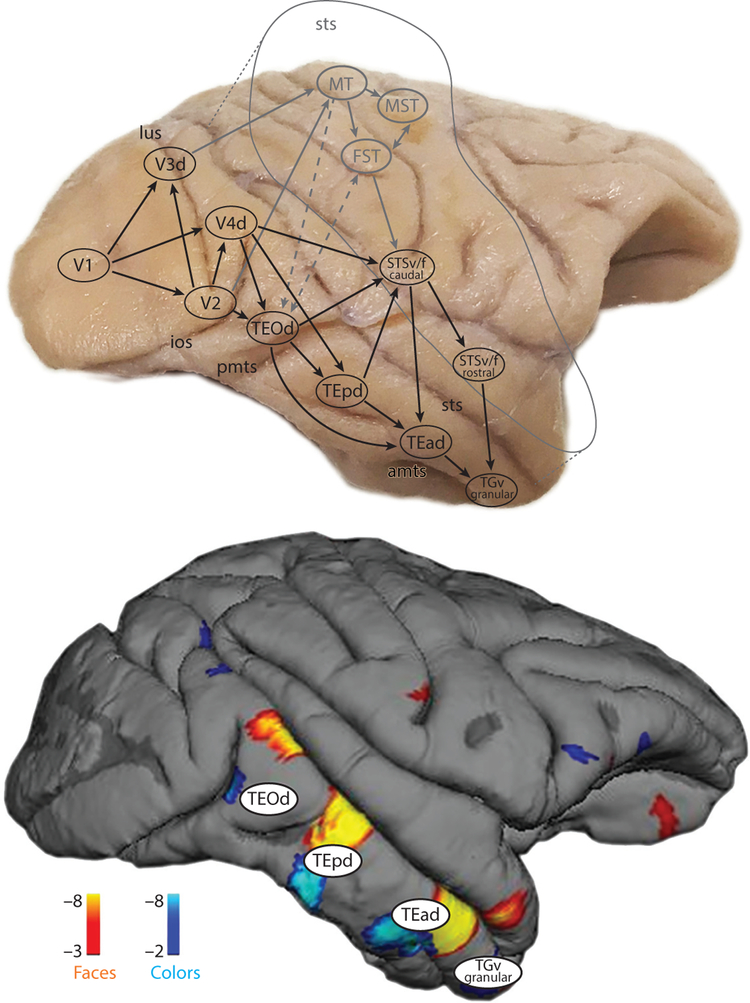
Figure 3.
The location of the functional activation patterns in inferior temporal cortex are predicted by nodes in the anatomical connectivity map. Top panel shows the serial stages of the major anatomical projections through the ventral visual pathway. The anatomy also uncovers several parallel pathways along the posterior-to-anterior axis. Regions of the dorsal pathway are shown in gray text. Bottom panel shows the functional activation patterns to faces (orange) and colors (blue) in an example macaque monkey. Top panel adapted from Kravitz et al. (2013) and bottom panel from Lafer-Sousa & Conway (2013). Abbreviations: amts, anterior middle temporal sulcus; d, dorsal; f, fundus; FST, floor of superior temporal sulcus; ios, inferior occipital sulcus; lus, lunate sulcus; MST, medial superior temporal area; MT, middle temporal area; pmts, posterior middle temporal sulcus; sts, superior temporal sulcus; STSf, fundus of the superior temporal sulcus; STSv, lower (ventral) bank of the superior temporal sulcus; TEad, dorsal subregion of anterior TE; TEOd, area TEO, dorsal part; TEpd, dorsal subregion of posterior TE; TGv, ventral temporal pole; v, ventral.

