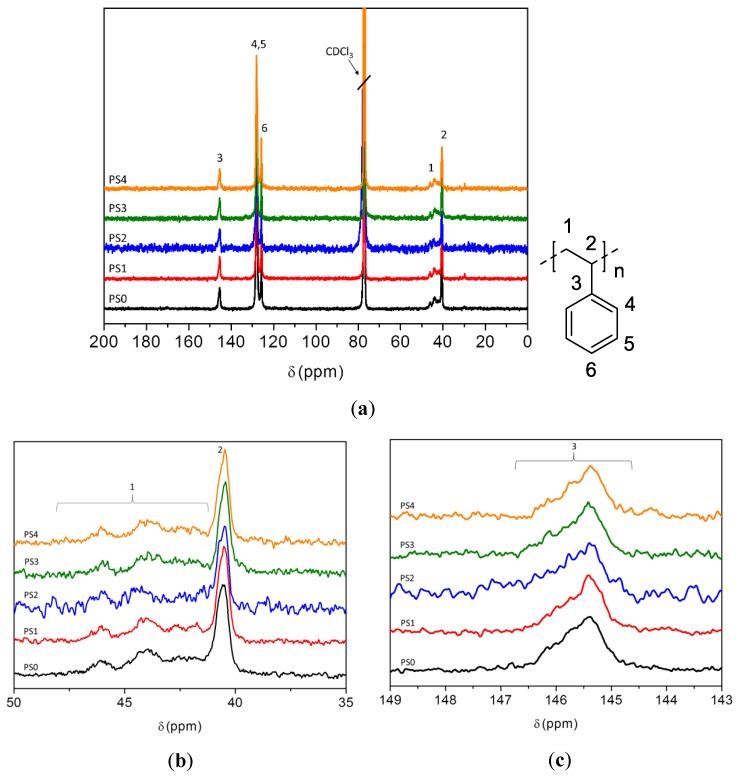
Figure 5.
Full stacked proton decoupled 13C-NMR spectra of the PS0 (original) and PS1–4 (thermally treated) samples (a) and (b) expansions of the backbone methylene/methine (c) and ipso carbon regions 1H-NMR spectra of the PS1–4 (thermally treated) samples. Labels 1–6 indicate the carbon atoms on the PS diagram featured.

