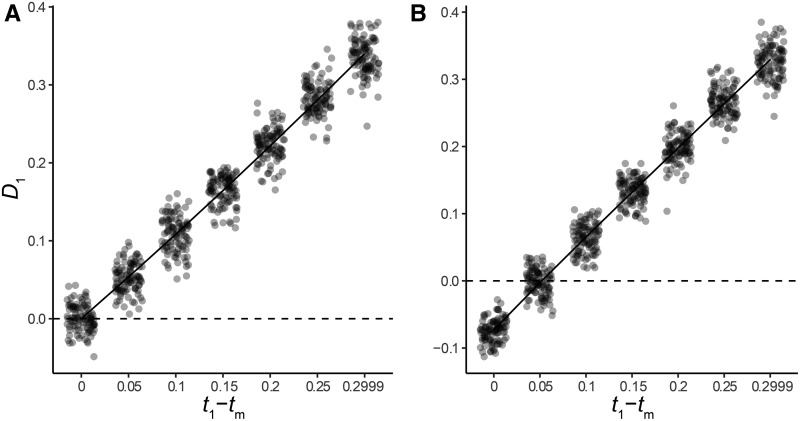
Figure 4.
D1 as a function of the difference in the timing of speciation and introgression, for introgression in (a) the C→B direction only, and (b) in both directions. Dots represent values obtained from simulations, with jitter added for clarity. The solid line shows the expected values from our coalescent model, while the dashed line shows the null hypothesis of t1 − tm = 0. Time on the x-axis is measured in units of 4N. 100 simulated datasets are shown for each value of t1 − tm.

