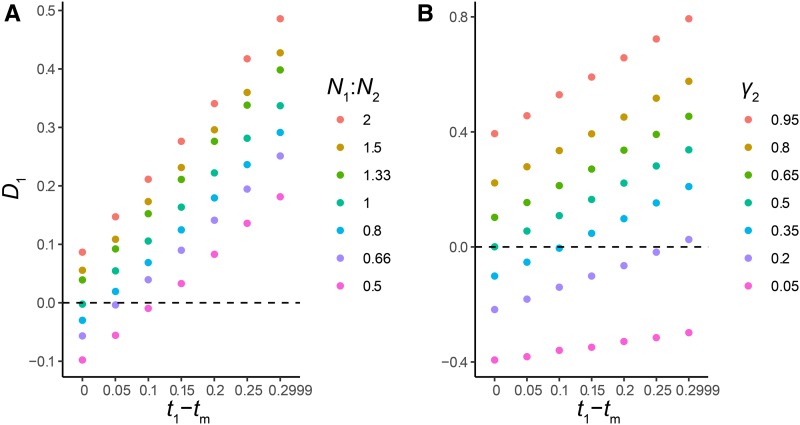
Figure 5.
D1 as a function of variation in N1/N2 and γ2. (a) Simulations show that variation in N1/N2 (color legend) changes the mean value of D1. Each point represents the mean value of D1 across 100 simulated datasets. (b) Simulations show that variation in γ2 (color legend) changes the mean value of D1. Each point represents the mean value of D1 across 100 simulated datasets. For clarity, the variance of simulated D1 statistics is not shown; it is similar to Figure 4.

