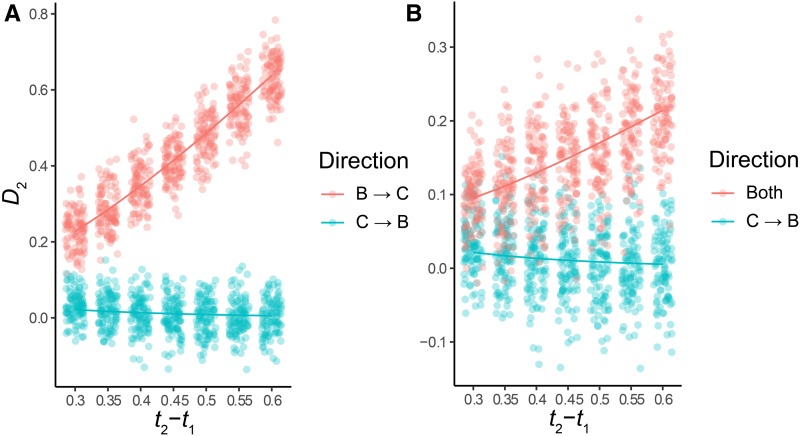
Figure 6.
D2 as a function of the time between speciation events, t2 − t1. The color legend denotes the direction of introgression, with the solid line showing expected values from our model, and the points showing simulated values. (a) contrasts the two directions individually, while (b) contrasts C→B introgression with introgression in both directions. Time on the x-axis is measured in units of 4N. 100 simulated datasets are shown for each value of t2 − t1 for each direction.

