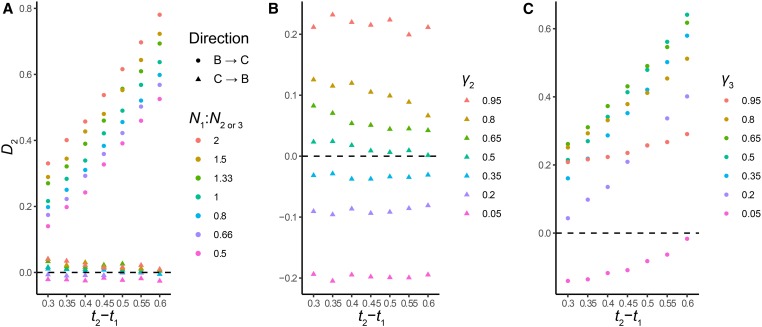
Figure 7.
D2 as a function of variation in N1/N2 and γ2. (a) Effects of variation in N (color legend) on D2 for both directions of introgression (shape legend) (null hypothesis C → B). Each point represents the mean of 100 simulated datasets. (b) Effects of variation in γ2 (color legend) on D2 for C → B introgression (the null hypothesis). Each point represents the mean of 100 simulated datasets. (c) Effects of variation in γ3 (color legend) on D2 for B → C introgression. Each point represents the mean of 100 simulated datasets. For clarity, the variance of simulated D2 statistics is not shown; it is similar to Figure 6.

