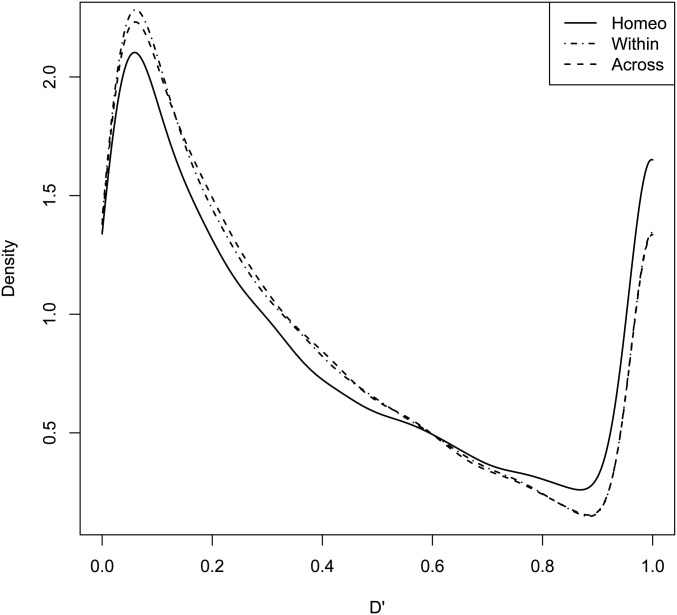
Figure 6.
Smoothed densities of standardized D’ statistics of linkage disequilibrium for expected and observed joint allele frequencies for Homeo, Within, and Across marker sets. KS tests were used to determine if the distribution of LD differed between Homeo and Within (KS P-value =) or Across (KS P-value =) marker sets.

