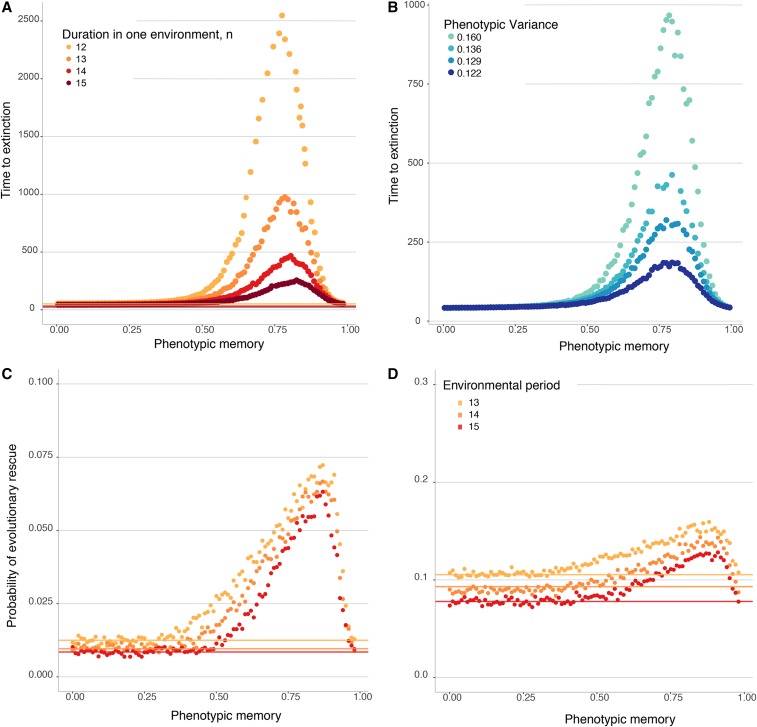
Figure 4 (A and B).
Population persistence in periodically changing environments. The dots represent the mean time before population extinction across 10,000 replicate simulations. All populations are initiated at , with a carrying capacity , with a single-mutant genotype a drawn with a random phenotype introduced into one of the two random different environments. The two environments then cycle deterministically with each environmental epoch lasting n time units, where time is measured in units of the expected life span of an individual. (A) Mean time until population extinction for a range of different environmental periods, with , , and Var. The lines, each corresponding to a different value of n, show the mean time to extinction of a population comprised of only wild-type A alleles. (B) Mean time until population extinction for different amounts of phenotypic variability, Var, with a fixed environmental duration of units, , and . (C and D) Probability of evolutionary rescue in periodically changing environments from a resistance mutation. The dots represent the probability of evolutionary rescue for a phenotypically variable population, while the lines represent this probability for a phenotypically fixed population, across 10,000 replicate simulations. All populations are initiated at , with a carrying capacity , with a single-mutant genotype a drawn with a random phenotype introduced into one of the two random different environments. The two environments then cycle deterministically with each environmental epoch lasting n time units (with n as in the legend), where time is measured in units of the expected life span of an individual. Here, the birth rate of the resistance allele R is 1.5, , , and Var. (C) Mutation rate to R is . (D) Mutation rate to R is .

