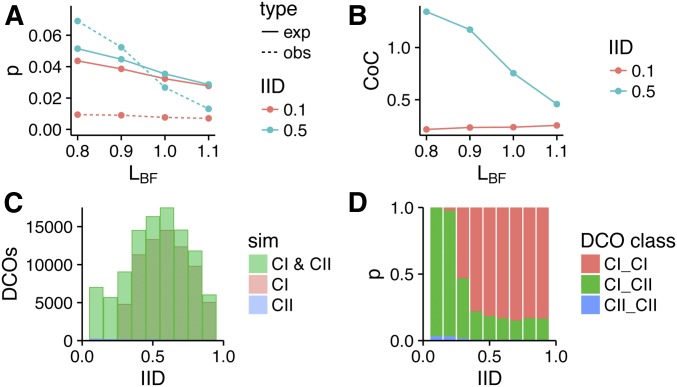
Figure 4.
Influence of IID on CoC response to changes in LBF. (A) The expected (solid line) and observed (dashed line) proportion of interval pairs receiving a DCO for two different IIDs; calculated from simulations with varying values of LBF. (B) CoC values for two IIDs calculated from simulations with varying values of LBF. (C) The number of DCOs observed for different IIDs from simulations involving CI and CII, CI, or CII crossovers. (D) The proportions of DCOs formed between two CI crossovers (CI_CI), two CII crossovers (CII_CII), or a CI and a CII crossover (CI_CII) for different IIDs. CI, class I crossover; CII, class II crossover; CoC, coefficient of co-incidence; DCO, double crossover; exp, expected; IID, interinterval distance; LBF, stress-relief distance; obs, observed; sim, simulated.

