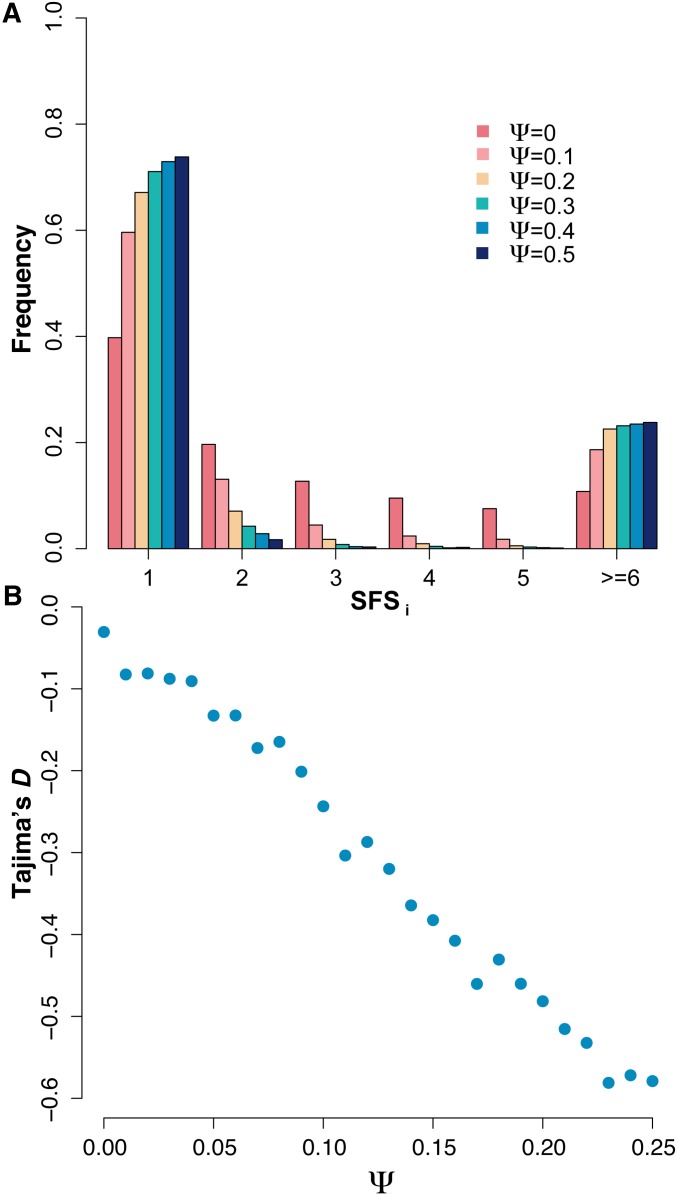
Figure 1.
(A) The site frequency spectrum (SFS) for , derived from values averaged over 100 replicate simulations at with sample size . (B) The value of Tajima’s D for averaged across 100 replicate simulated populations with sample size . As shown, offspring skew strongly biases commonly used summary statistics, even under equilibrium neutrality.

