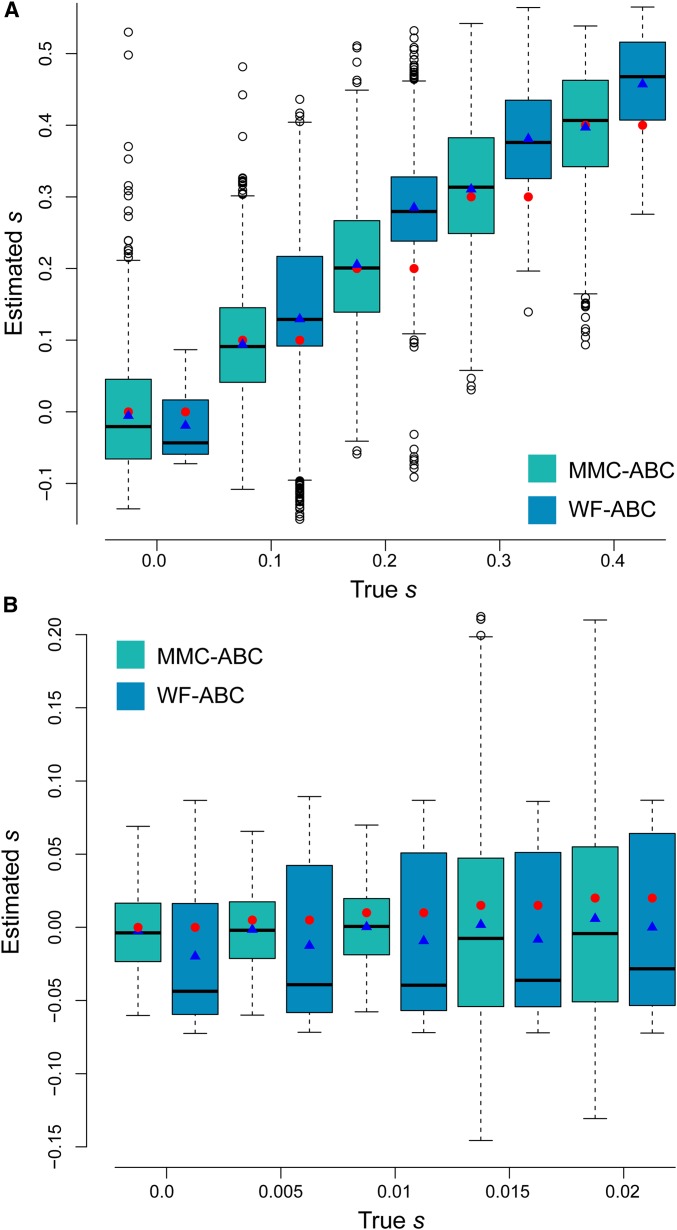
Figure 4.
(A) Estimation of s by MMC-ABC and WF-ABC for 1000 sites under selection for with the true values of and provided to MMC-ABC and the true value of N provided to WF-ABC. Results presented in a standard box plot with the box as the first, second, and third quartiles, and the whiskers as the lowest and highest datum within the 1.5 interquartile range of the lower and upper quartiles, respectively. Red circles indicate the true value of s, and blue triangles indicate the sample mean. (B) Estimation for with the same conditions as above. WF-ABC tends to underestimate s for neutral alleles and overestimate s under strong positive selection under sweepstakes reproduction.

