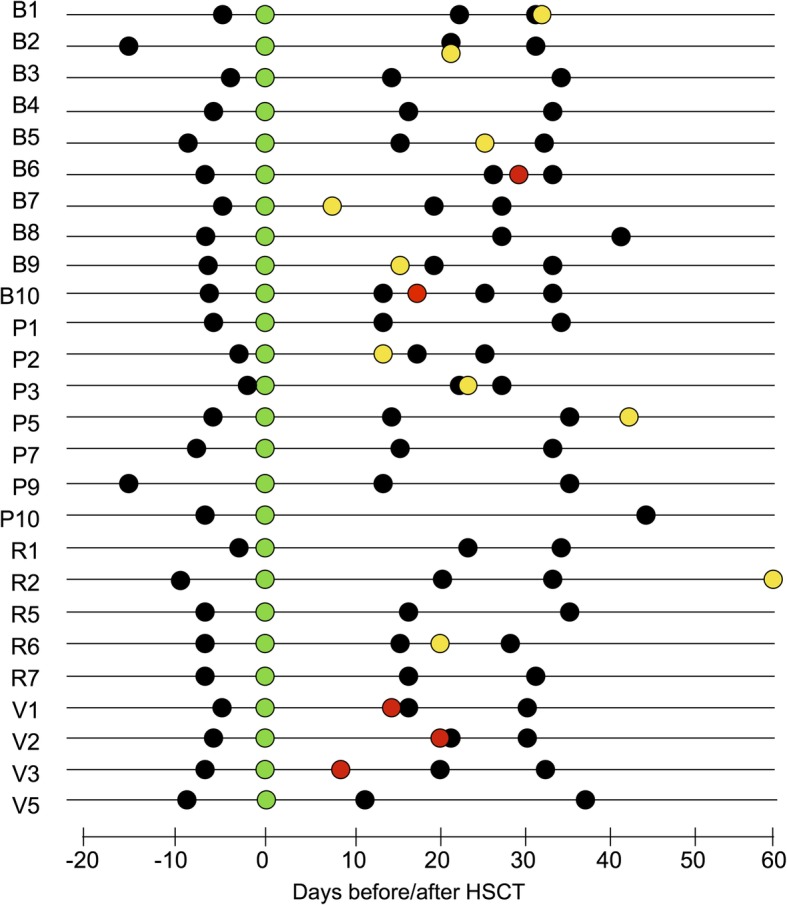
Fig. 1.

Schematic overview of the sampling time for each enrolled subject. Subjects are indicated with a progressive number preceded by a letter associated with the enrolling center (B, Bologna; P, Pavia; R, Rome; V, Verona). HSCT (green dots), skin grade I-III aGvHD diagnosis (yellow dots), gastrointestinal grade II-IV aGvHD diagnosis (red dots), and fecal sample collection (black dots) are plotted on timelines with distance from HSCT expressed in days
