Fig. 2.
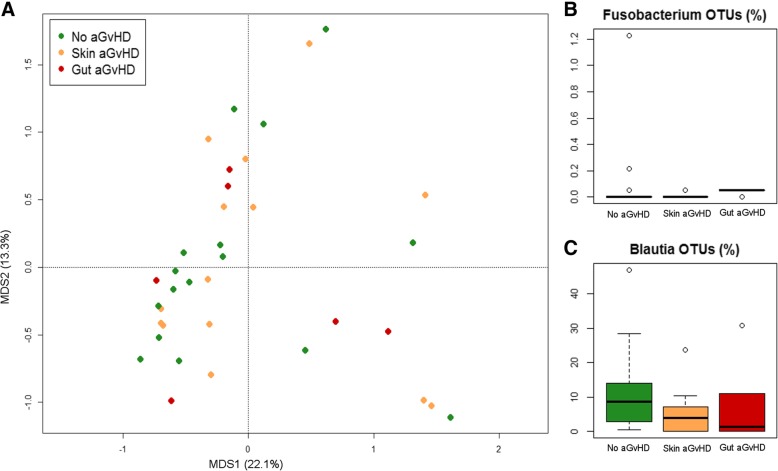
Gut microbiota variability before HSCT, in relation to aGvHD development. a PCoA based on Bray-Curtis distances of genus-level relative abundance profiles of samples collected before HSCT from patients who did not develop aGvHD (green), who developed aGvHD (I-II grade) only involving the skin (gold), and who developed gastrointestinal aGvHD (II-IV grade) (dark red). Samples are identified by filled circles. First and second principal components (MDS1 and MDS2) are plotted, accounting for 22.1 and 13.3% of variance in the dataset, respectively. Box and whiskers distribution of the relative abundance (%) of OTUs assigned to the genera Fusobacterium (b) and Blautia (c) in samples collected before HSCT from subjects who did not develop aGvHD (green), who developed aGvHD (I-II grade) only involving the skin (gold), and who developed gastrointestinal aGvHD (II-IV grade) (dark red)

