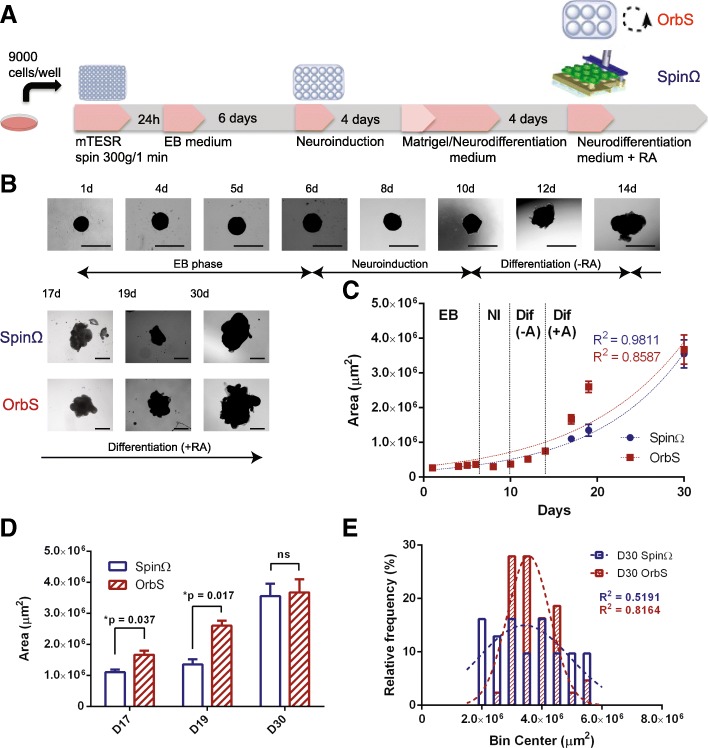
Fig. 1.
Growth curves, size distribution, and morphology obtained with the orbital shaker and SpinΩ bioreactor. a Workflow for brain organoid preparation. b Organoid morphology on selected days of the 30-day culture period, with arrows indicating the length of exposure to each medium condition. On day 14, organoids were divided into growth in the orbital shaker (red) and in the SpinΩ (blue). Scale bar = 1000 μm. c. Area growth curves (μm2) from day 1 to day 30, from n = 2 independent tests. Each test replicate contained at least 12 individual brain organoids. Lines represent exponential curve fit for the SpinΩ (blue) and orbital shaker (red), with correlation coefficients for each curve displayed on the graph. d. Comparison of area growth between the SpinΩ and shaker groups *p < 0.05. e. Histographic analysis of organoids grown in the SpinΩ and orbital shaker on day 30 (area in μm2) showing relative frequencies in terms of the percentage of automatically binned size. Data were pooled from two independent tests, n = 31 for the SpinΩ and n = 43 for the orbital shaker

