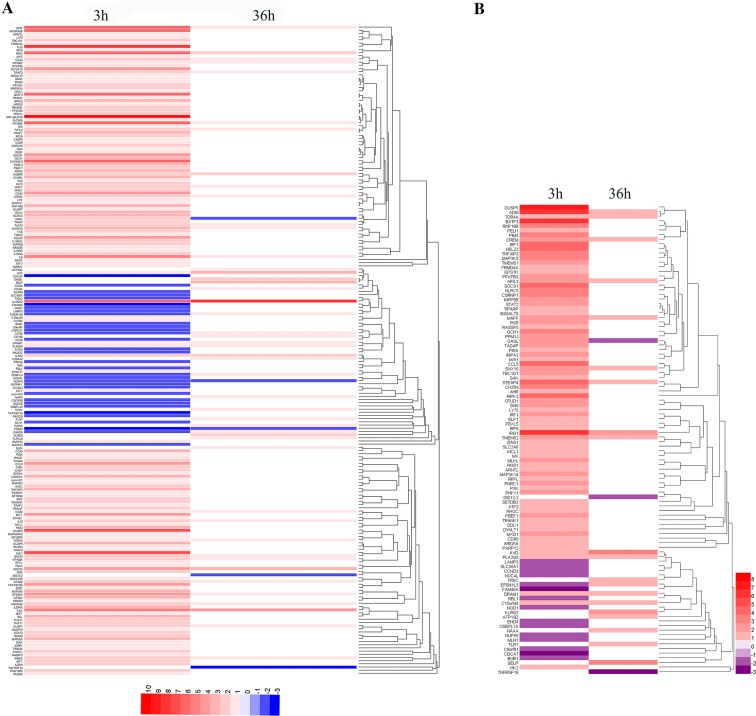
Figure 5.
Heatmap of immune-related DEG at different time points after ALV-J infection. DEG with similar expressed patterns were clustered and are displayed in a heatmap format. Color intensity corresponds to relative expression level normalized according to log2 fold change. A Selected immune-related DEG from 3 hpi and 36 hpi. Red, up-regulated DEG; blue, down-regulated DEG. B ISG expression in MDM at 3 hpi and 36 hpi. Red, up-regulated ISG; purple, down-regulated ISG.

