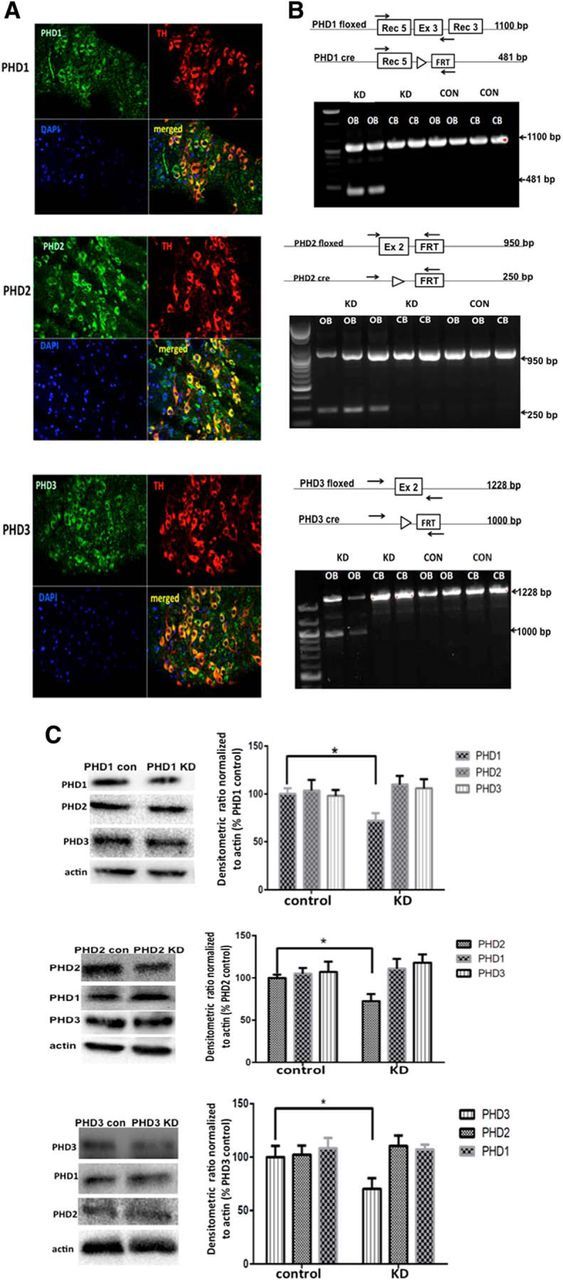
Figure 1.

Dopamine-specific knockdown of individual PHD isoforms in vivo. A, Representative in vivo analyses of PHD1, PHD2, and PHD3 ICC demonstrating expression in both DAergic and non-DAergic cell types in SN. SN sections were separately stained for PHD isoforms (green, ×40) and TH (upper right; red, ×40), and nuclei counterstained with DAPI (lower left; blue, ×40); merged, lower right. B, Gene targeting strategy for generating pTH-PHD knockdown (KD) lines and confirmation of PHD isoform-specific deletions. Top, Schematic of genetic location of floxed PHD alleles (PHD floxed) and expected deletion products (PHD cre), forward and reverse primers used for the PCR analyses (arrows), and expected sizes of PCR products before and after Cre-mediated deletion. Bottom, PCR confirming deletions in DAergic-enriched OB versus CB negative controls isolated from pTH-CRE-floxed PHD mice (KD) versus floxed PHD controls (CON). C, Representative Western blots demonstrating select PHD isoform reduction in striatal tissues from pTH-CRE-floxed PHD lines (left); densitometric quantitation (right); *p < 0.05 for PHD con versus KD; Tukey's multiple-comparison test.
