
Figure 5.
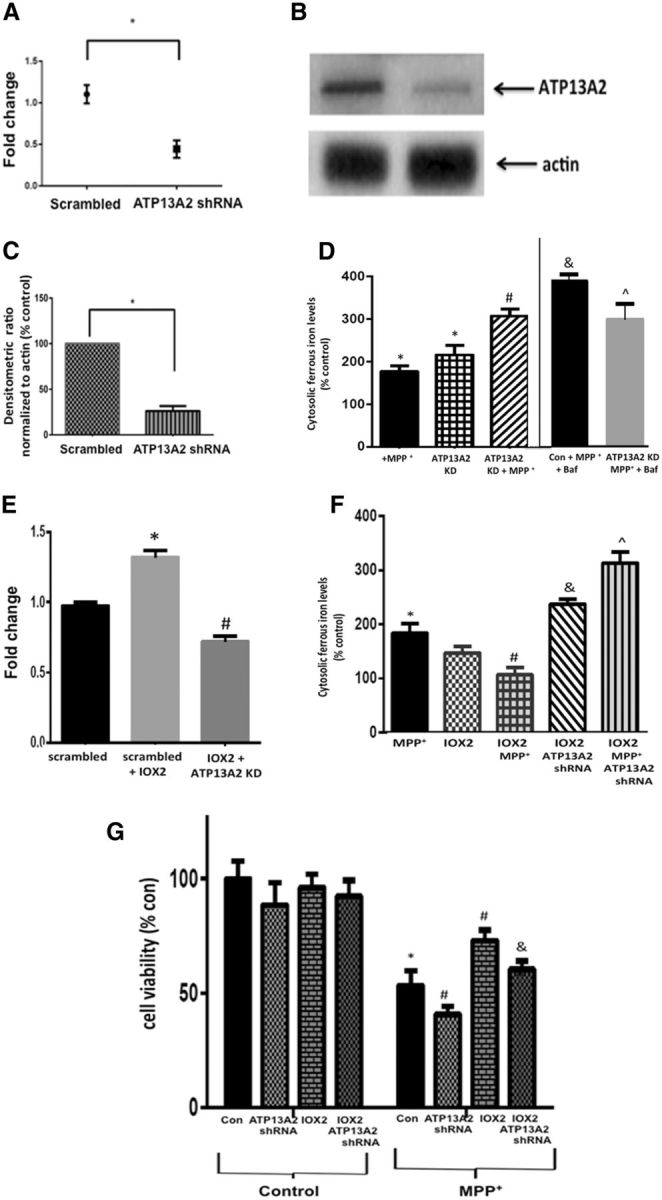
Knockdown (KD) of ATP13A2 expression in cultured human DAergic cells results in reduced ability to maintain lysosomal iron storage and abrogates PHD2 inhibition-mediated neuroprotection under conditions of stress. A, RT-PCR analysis of ATP13A2 levels in SH-SY5Y cells stably transfected with lentiviral ATP13A2 shRNA shows a significant reduction in ATP13A2 expression. Data are expressed as fold change; *p < 0.01 versus scrambled shRNA controls; unpaired t test. B, Representative Western blot of ATP13A2 levels in ATP13A2 shRNA transfected cells versus controls. C, Quantitation following normalization to actin (right) demonstrates corresponding reductions in ATP13A2 protein levels. Data are reported as percentage scrambled shRNA; *p < 0.01 versus scrambled; unpaired t test. D, Cytosolic ferrous iron measurements via calcein dequenching assay in stable differentiated ATP13A2 shRNA versus scrambled control SY5Y cells demonstrate that levels are increased following ATP13A2 KD both basally and following treatment with MPP+; bafilomycin results in significantly higher increases in cytosolic ferrous iron in MPP+ controls versus MPP+-treated ATP13A2 KD cells. Values are presented as percentage control; *p < 0.05 versus scrambled controls; #p < 0.05 versus MPP+, &p < 0.05 versus MPP+-treated controls; p̂ < 0.05 versus MPP+-treated KDs; Tukey's multiple-comparison test. E, RT-PCR analysis of ATP13A2 expression levels in the absence and presence of IOX2 demonstrates increased expression in scrambled controls, which is reduced by ATP13A2 shRNA. Data are reported as fold change; *p < 0.01 versus scrambled control; #p < 0.05 versus IOX2 alone; Tukey's multiple-comparison test. F, Cytosolic ferrous iron levels in MPP+-treated versus control cells in the absence and presence of IOX2 and ATP13A2 KD; values are presented as percentage controls. IOX2 prevents MPP+-mediated increases in cytosolic ferrous iron and this is reversed by knockdown of ATP13A2; *p < 0.05 versus controls; #p < 0.05 versus MPP+ alone; &p < 0.05 versus IOX2 alone; p̂ < 0.05 versus IOX2 KD; Tukey's multiple-comparison test. G, Cell viability as assessed by CyQuant fluorescence assay in differentiated control versus ATP13A2 KD cells in the absence or presence of IOX2 and MPP+; values are presented as percentage control. MPP+-mediated losses in cell viability are exacerbated by ATP13A2 KD both basally and in the presence of IOX2; *p < 0.05 versus controls, #p < 0.05 versus MPP+-control, &p < 0.05 versus MPP+, IOX2-treated control; Tukey's multiple-comparison test.