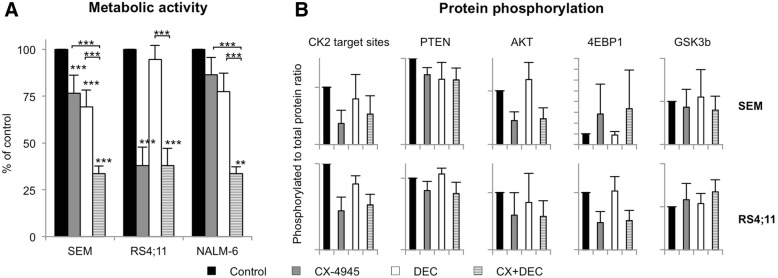
Fig. 3.
Effects of combined CK2 and DNMT3A inhibition in B-ALL cell lines. a The WST-1 metabolism assay was used to evaluate metabolic activity after 72 h incubation of CX-4945 (5 μM) and/or DEC (0.1 μM). Metabolic activity of control cells was set to 100%. Three technical replicates were performed for each sample (mean + SD; n ≥ 3; * p < 0.05, ** p < 0.01, *** p < 0.005). b Phosphorylation of PI3K/AKT pathway proteins was assessed by western blot analysis and subsequent quantification of bands as described before. For protein activity assessment the ratio between phosphorylated and total protein form was calculated and compared to control cells set to 100%. For CK2, phosphorylation of CK2 target sites was determined and compared to the total form of CK2 alpha (mean + SD after 24 h (SEM) or 2 h (RS4;11) incubation with 5 μM CX-4945 and/or 0.1 μM DEC; n = 3)

