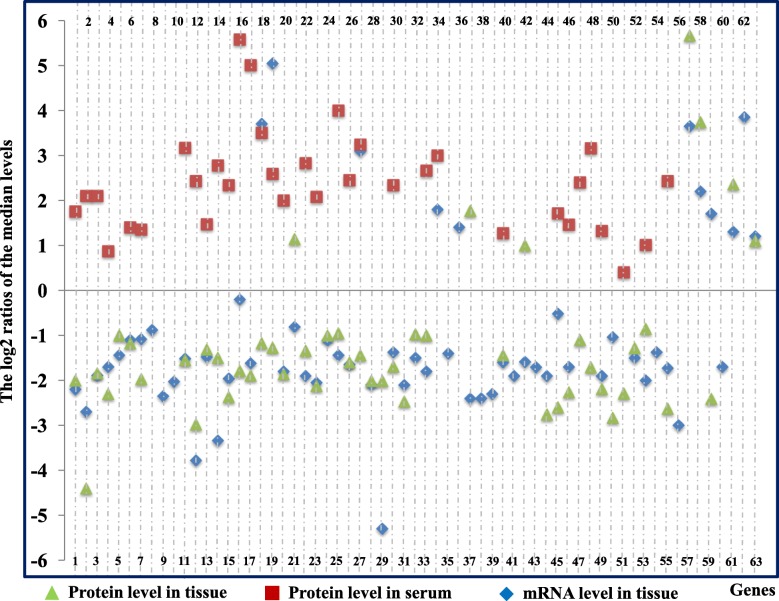
Fig. 1.
Expression profiles of complement and complement-related components in serum and cancer tissues from patients with lung cancer. X-axis: Numbers 1 to 63 represent C1s, C1r, C1QA, C1QB, C1QC, C2, C4d/C4, MASP1, CFD, CFP, CFB, C3, C5, C6, C7, C8A, C8B, C8G, C9, C1NH, C1QBP, CFI, C4BPA, C4BPB, CFH, CLU, VTN, VWF, SERPINA1, SERPINA3, CD55, CD59, CD44, CD46, CD35/CR1, CD21/CR2, CD11b/CR3, CD11c/CR4, CD18/CR3, MRC1, C3AR1, C5AR1, C3bR, C1QR1, APOA1, APOA2, APOA4, APOB, APOC1, APOC2, APOC3, APOD, APOE, APOL3, A2M, SERPINB1, SERPINB2, SERPINB5, SERPIND1, SERPINF1, SERPINH1, SERPINI1 and SERBP1, respectively. Complement-related components were indicated in italics to distinguish them from complement components. The values on the Y-axis represent the log2 ratios of the median levels calculated for the values extracted from independent references. The blue diamonds and light green triangles represent the log2 ratios of mRNA and protein levels in lung tissues, respectively. The red rectangles represent the log2 ratios of serum protein levels. The concentrations of 25 components (C1s, C1r, C1QA, C1QB, C2-C7, C8A, C8B, C1NH, CFI, C4BPA, CFH, CLU, SERPINA3, CD44, MRC1, APOA1, APOA2, APOC1, APOE and A2M) showed opposite trends: reduced mRNA and protein levels in lung cancer tissues but increased plasma protein levels in patients

