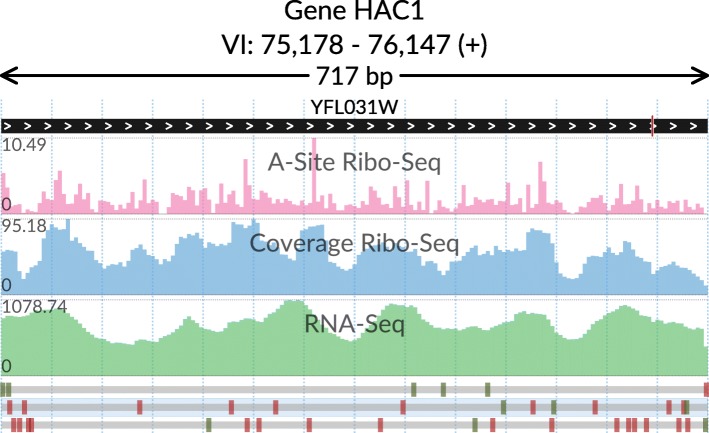
Fig. 1.
Transcript-centric selection and visualization of a genomic window. The top track shows the YFL031W transcript structure with the collapsed intronic region (short red bar on the right). The tracks in the middle show Ribo-Seq (ribosome A-sites and aggregated read density) and RNA-Seq (aggregated read density) signals. The bottom track shows the 0, + 1, and + 2 reading frames with the start and stop codons marked by green and red bars, respectively. The transcript open reading frame is highlighted. The data is taken from [17]

