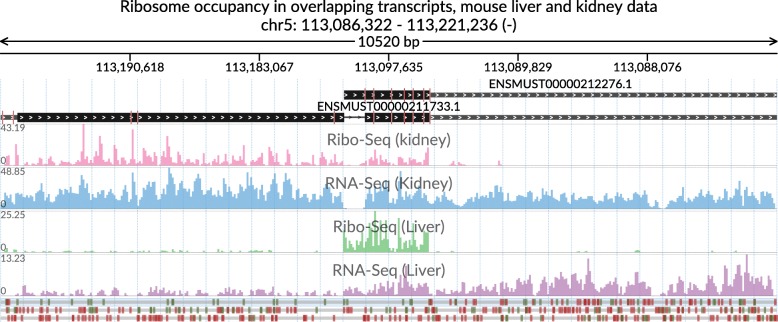
Fig. 3.
Ribo-Seq and RNA-Seq aggregated coverage signals in mouse kidney and liver data. The genomic window is centered on overlapping annotated transcripts displaying tissue-specific ribosome occupancy (Ribo-Seq tracks) and transcript abundance (RNA-Seq tracks). The red marks on the transcript structure track (on top) correspond to the collapsed intronic regions which are reconcilable for both shown transcripts. The data is taken from [20, 21]

