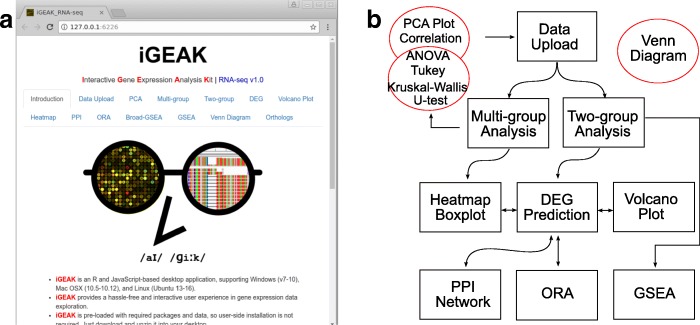
Fig. 2.
iGEAK’s analysis steps represented by “tab”s (a) and actual workflow (b). After locally uploading 3 input files, users can choose “Multi-group” analysis path including sample PCA analysis, sample correlation analysis, parametric (Analysis of Variance (ANOVA) / Tukey) tests, and non-parametric (Kruskal-Wallis / U-) tests. Users can also create heatmap and boxplots displaying gene expression levels across multiple sample groups. If users choose “Two-group” path, differentially expressed genes are first predicted (“DEG”) and this step subsequently affects “Heatmap”, “Volcano Plot”, “PPI”, and “ORA” tabs. iGEAK uses all genes from two sample groups to perform “GSEA” analysis and to generate 3 input files for the Broad-GSEA program

