
Fig. 1.
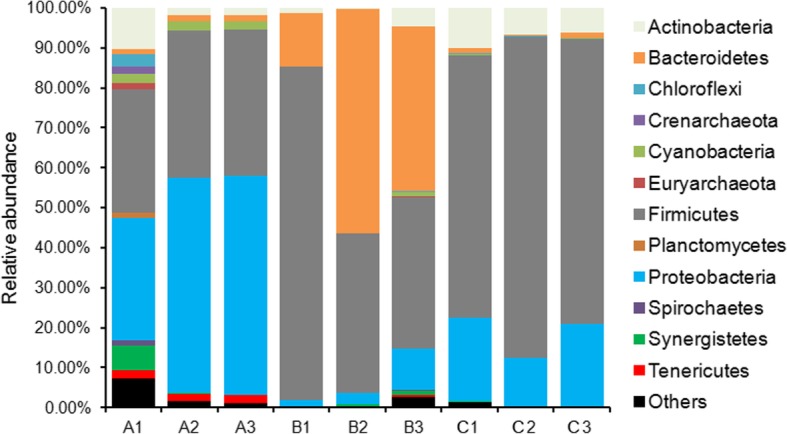
Dominant phyla in gut microbiota of chicken. Across all samples, total sequences were assigned to 41 phyla. The percentage bar diagram shows the composition of the dominant phyla in the chicken gut microbiota in different groups. Groups A, B, C represent three different treatments as follows: Group A was fed basal diet + 2% green tea powder; group B was fed basal diet + 4% mulberry leaf powder; group C was fed only basal diet as control. Each treatment was performed in three replicates (marked 1, 2, and 3)