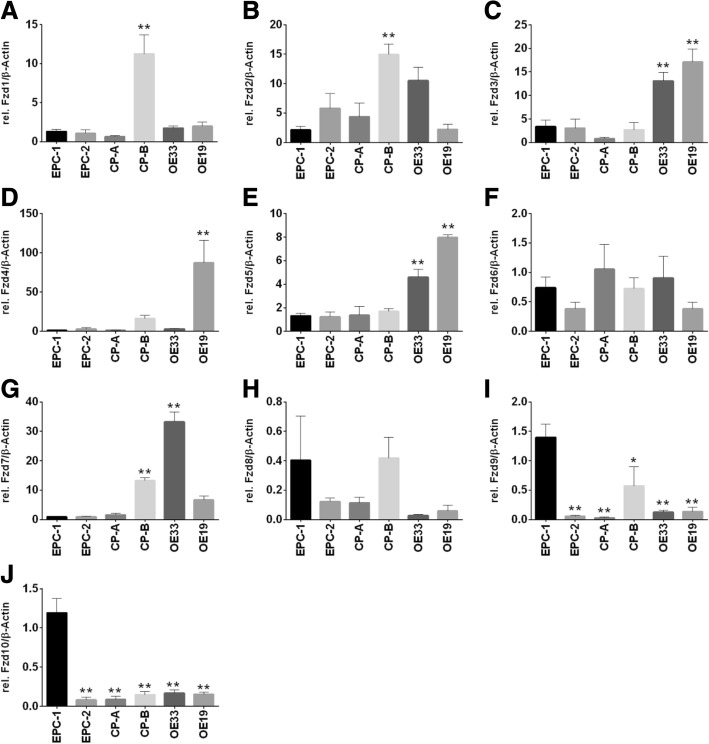
Fig. 2.
Expression of the membranous receptors Fzd1–10 along Barrett’s sequence. Expression of the receptors Fzd1–10 (a-j) were analyzed in EPC-1 and EPC-2, CP-A, CP-B, OE33 and OE19 cells by quantitative Real time RT-PCR. Highest expression levels of Fzd1 (a) and Fzd2 (b) were detected in CP-B. The receptors Fzd3 (c), Fzd4 (d) and Fzd5 (e) were strongly expressed in OE19. Overall, the expression of Fzd6 (f) and Fzd8 (h) were marginal and varied during Barrett’s sequence. The highest expression of Fzd7 (g) was found in OE33. The epithelial cell line EPC-1 expressed the highest levels of Fzd9 (i) and Fzd10 (j). Normalization was done with β-Actin. Values are shown as mean ± S.E.M. (One-way-ANOVA with Bonferroni correction, * - p < 0.05, **- p < 0.01 compared to EPC-1)

