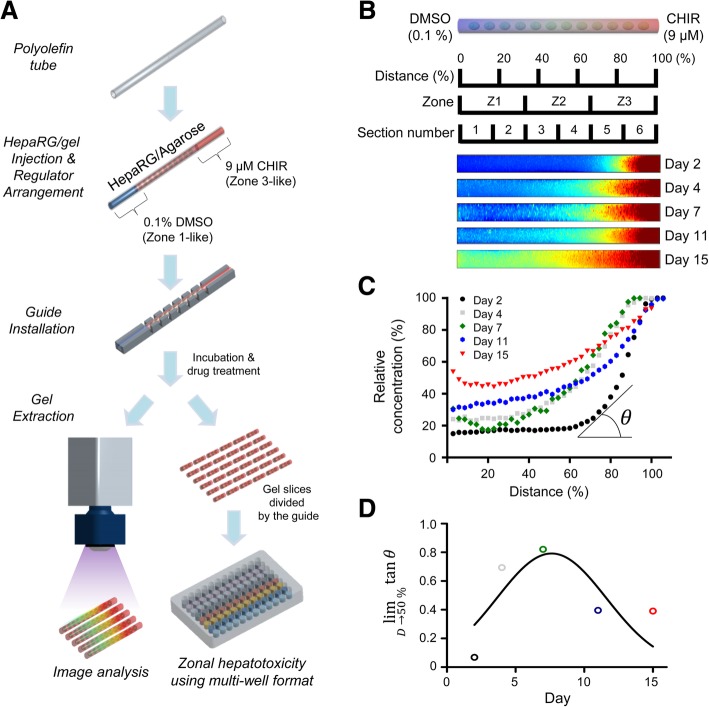
Fig. 3.
Development of the in vitro 3D hepatic zonation platform. a Schematic flow of the zonal hepatotoxicity evaluation system using the 3D hepatic zonal channel model. An agarose hydrogel gel containing HepaRG cells was injected into the polyolefin tube, and 3D HepaRG cells were cultured in the gel matrix for 7 days. For natural diffusion, 0.1% DMSO and 9 μM CHIR were located at the left (Inlet 1) and right side (Inlet 2) of the channel, respectively. The 3D hepatic zonal channel can be sliced into several pieces representing zone-1-like, zone-2-like and zone-3-like sections with the installed guide and then treated with hepatotoxic chemicals. b The relative CHIR diffusion in the 3D hepatic zonal channel was monitored for up to 15 days by UV illumination using the ChemiDoc XRS+ Imaging System. The intensity of CHIR across the 3D hepatic zonal channel was imaged using the MATLAB program. c The relative intensity of CHIR according to the distance from Inlet 1 to Inlet 2 was quantified using the MATLAB program and plotted. d The intensity-concentration curves for each time point were analysed with the curve-fitting method, and the linearity was calculated from the limit (lim) of tangent Ɵ approaching 50% of the distances. A tangent value close to 1 indicates the most linearity. On day 7, the CHIR concentration profile was close to a linear diffusion gradient in the 3D hepatic zonal channel

