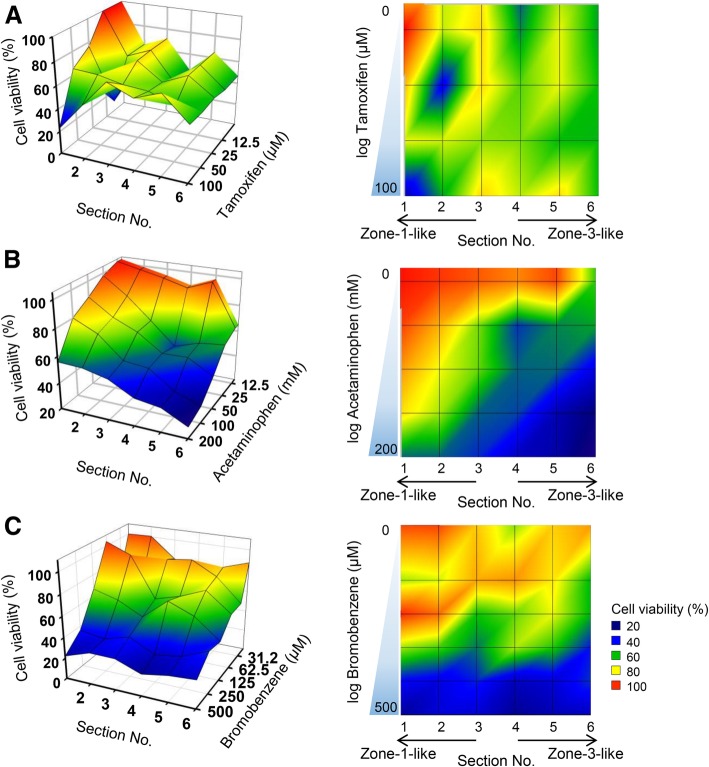
Fig. 5.
Imaging profiles of zonal hepatotoxicity using the 3D hepatic zonal channel model. Three different hepatotoxic drugs, tamoxifen (a), APAP (b), and bromobenzene (c), were administered to the sectioned 3D HepaRG sample with an CHIR gradient for 2 days, and cell viability was then evaluated as described in the Materials and Methods section. The values of the x-, y- and z-axes indicate the section number (from 1 to 6), cell viability, and drug concentration, respectively. The imaging profiles display the relative cell viability according to the colour legend. The red and blue colours indicate higher and lower cell viability, respectively

