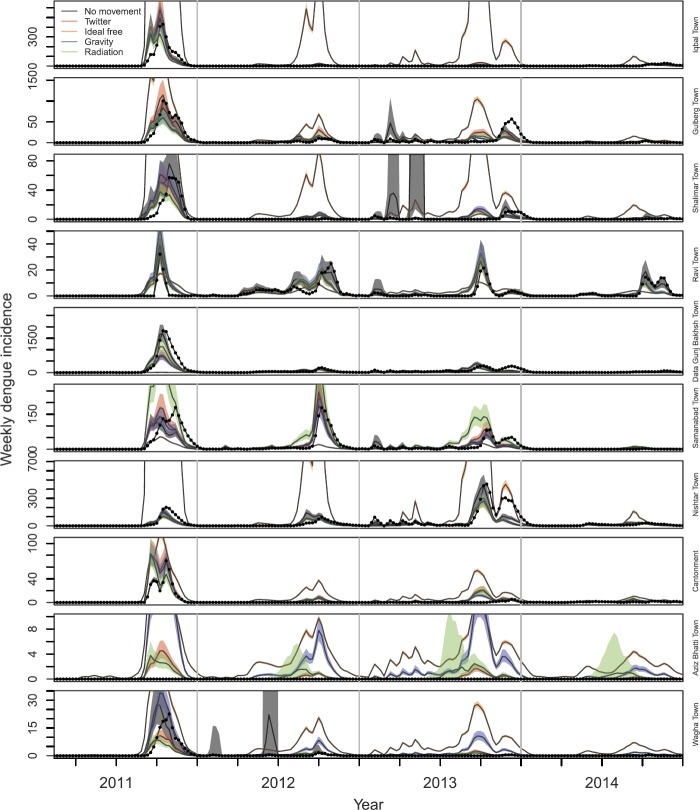
Figure 5.
Predicted values of residence-based incidence in each town (rows) using the best-fit model under each of five different assumptions about mobility (colors). Observed values of residence-based incidence in each town are shown with black dots, and bands show 95% confidence intervals on model predictions

