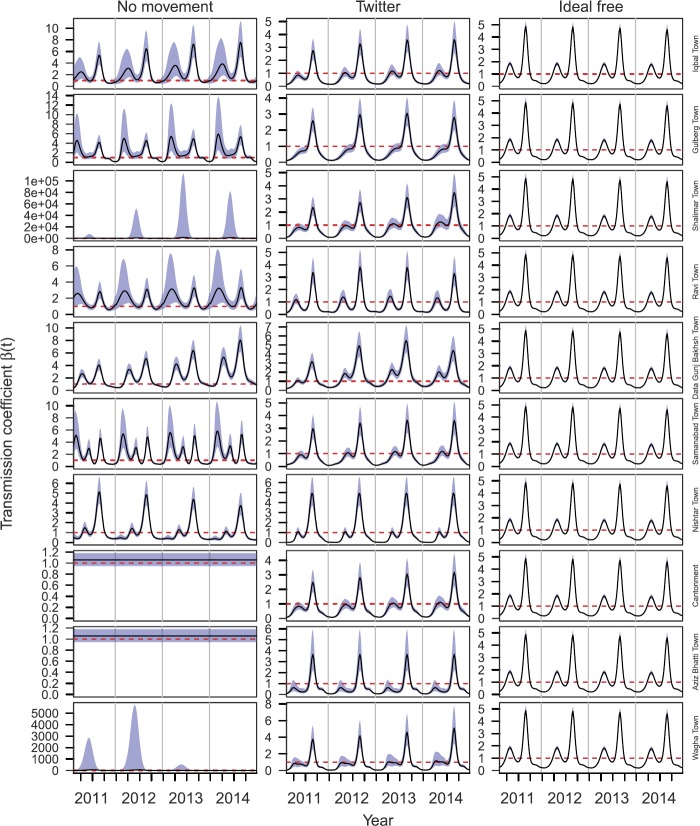
Figure 6.
Temporal variation in for different towns (rows) under three different mobility assumptions (columns): no movement (left), Twitter (center), and ideal free (right). The black line shows the mean of the best-fit model and blue bands show standard error around the mean. The dashed red line indicates where

