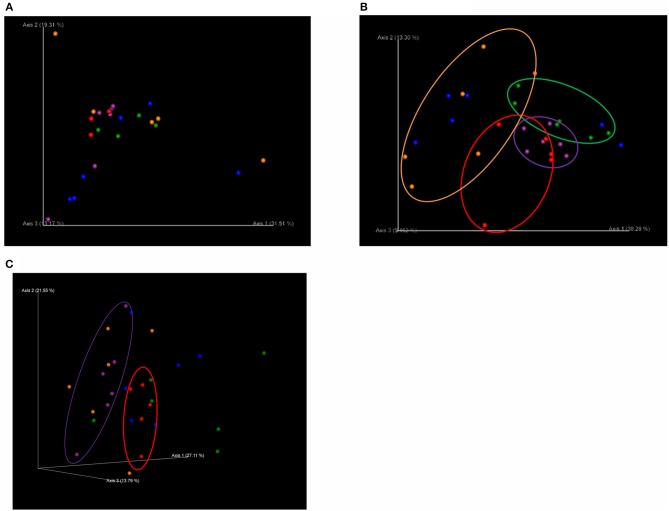
Figure 1.
Principal coordinates analysis (PCoA) plots based on weighted UniFrac distances of the bacterial community structures in the gut microbiota of post-weaning pigs that were fed probiotics-supplemented diets or a control diet on (A) the first day of Phase 1 (T1; day 0 post-weaning), (B) the final day of Phase 1 (T2; day 40 post-weaning), and (C) the final day of Phase 2 (T3; day 90 post-weaning). 3D PCoA plots were visualized using the program Emperor. Red: basal diet (C); green: basal diet + 1 g/kg of Product 1 containing live Enterococcus faecium (L); blue: basal diet + 1 g/kg of Product 2 containing heat-killed E. faecium (D); purple: basal diet + 1 g/kg of Product 3 containing live Clostridium butyricum (M); orange: basal diet + 1 g/kg of Product 4 containing live E. faecium + C. butyricum (L+M).

