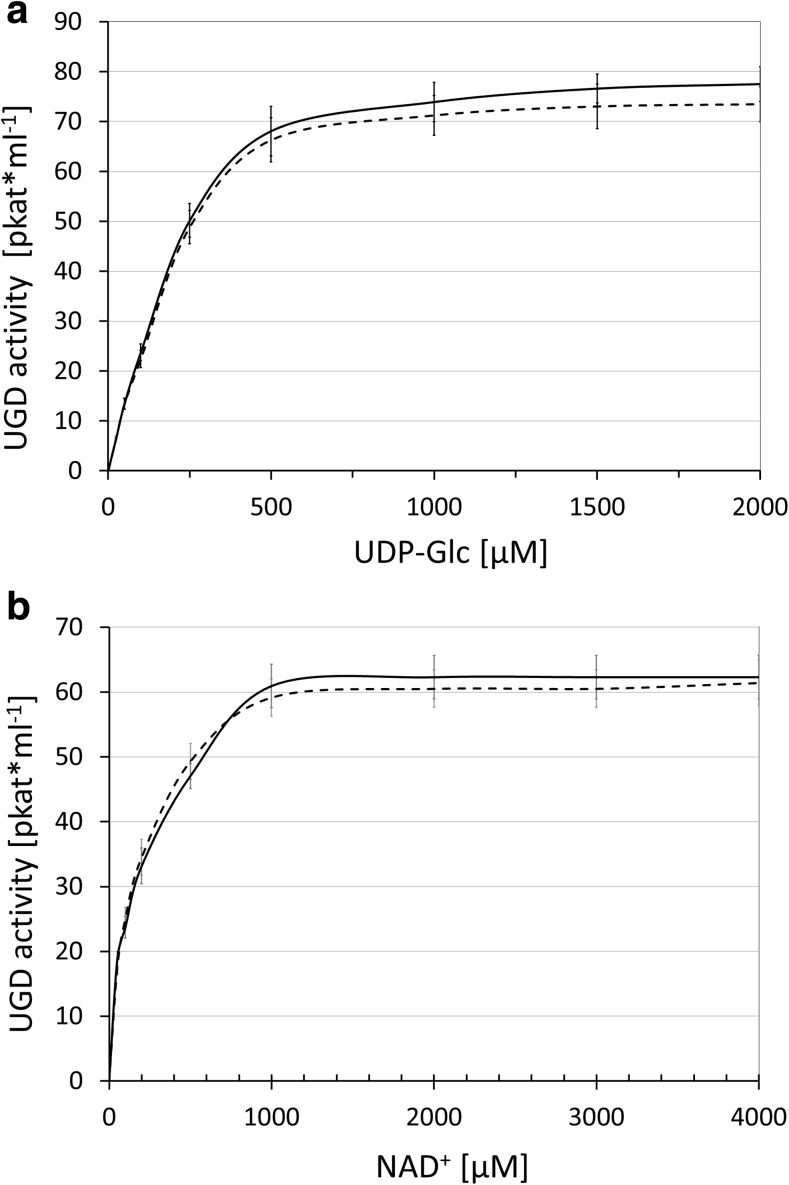
Fig. 6.
Kinetic of UGD and UGD-P. a The Km for UDP-Glc was determined for both forms of UGD showing the same Km and well as the same activity (Vmax). b The Km for NAD+ was determined for both forms of UGD showing the same Km as well as the same activity (Vmax). The dotted line represents the unphosphorylated control; the solid line the phosphorylated UGD-P

