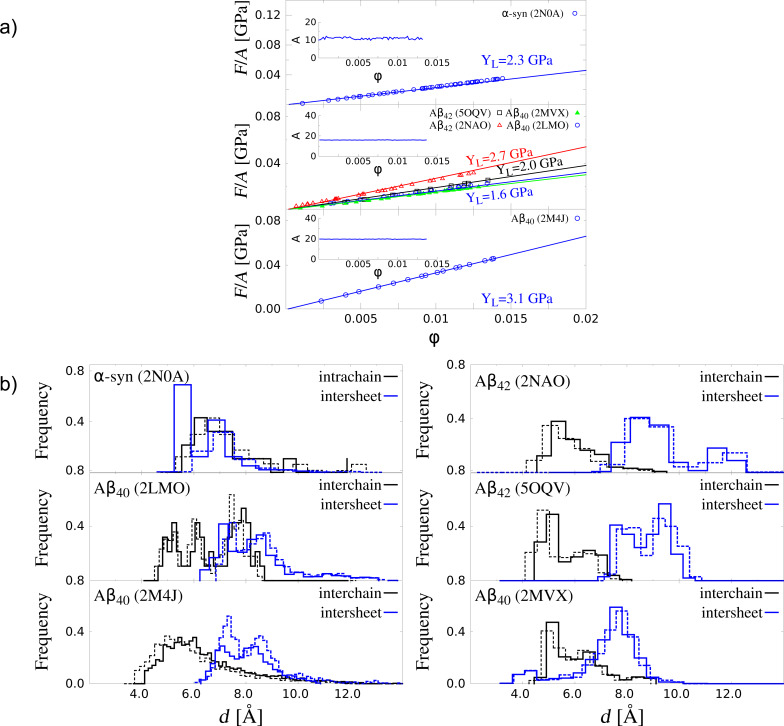
Figure 4.
Results of tensile deformation. (a) Stress–strain curves of α-synuclein, three Aβ40 and two Aβ42 fibrils. Circles correspond to v = 0.0005 Å/τ. The error bars are the same as the symbol size and they are based on 50 independent simulations for each structure. The insets show the corresponding cross-section areas in nm2 for the corresponding pulling speed. (b) Distributions of HB lengths for  (solid lines) and for a finite strain
  corresponding to the end of the linear regime (dashed lines): for α-syn the final
  , while
  for Aβ amyloids.

