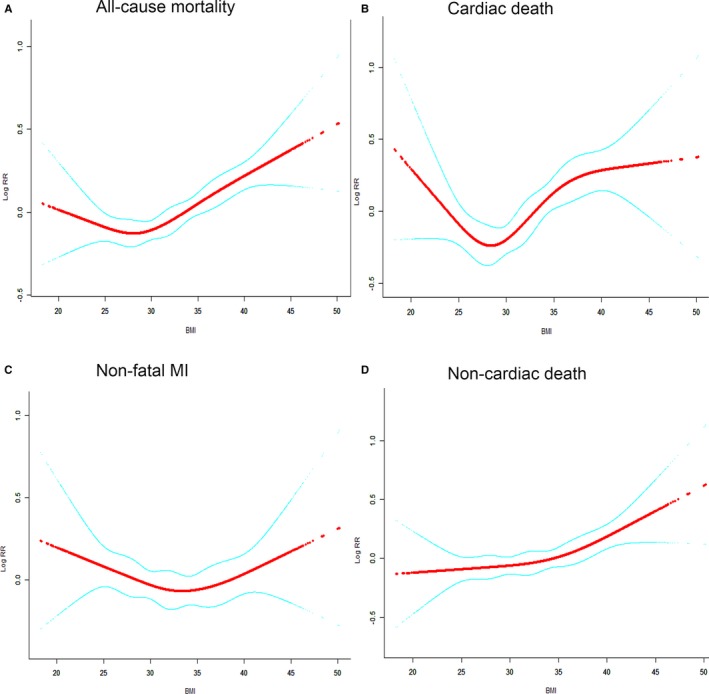
Figure 3.

Smooth spline curves of BMI for the estimation of risk of primary and second end points after adjusting multivariate rates. A, All‐cause mortality. B, Cardiac death. C, Nonfatal MI. D, Noncardiac death. Red line denotes fitted curves, and blue line represents 95% confidence intervals for the association between BMI and adverse events. All models were adjusted for cofounders in Figure 1. BMI indicates body mass index; MI, myocardial infarction.
