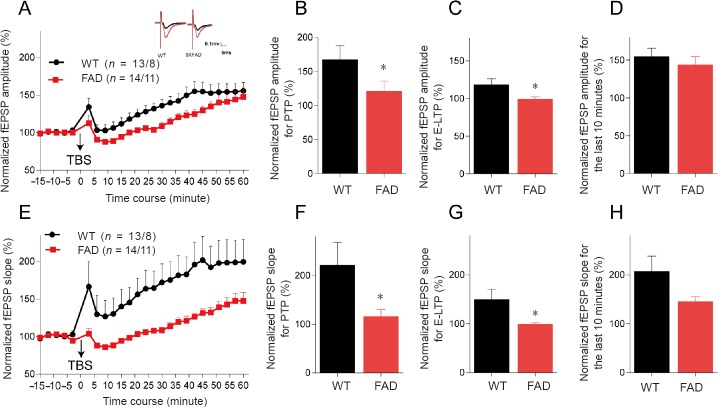
Figure 3.
LTP declines in the hippocampus of 5XFAD mice at 10 weeks old.
(A) Summary plots of normalized fEPSP amplitude (%) in recording time. fEPSPs were induced by 5XTBS (arrow). Inset traces: Representative traces of fEPSP before (black curve) and after (red curve) the induction of potentiation. (B) Normalized fEPSP amplitude (%) for post-tetanic potentiation (1–2 minutes after theta-burst stimulation). (C) Normalized fEPSP amplitude (%) for E-LTP (15–20 minutes after theta-burst stimulation). (D) Normalized fEPSP amplitude (%) for the last 10 minutes. (E–H) Statistical analysis of fEPSP slope (%) of LTP in the dentate gyrus of 5XFAD and WT mice. After 5XTBS, the fEPSP amplitude and slope of both groups increased over time. The increments of both amplitude and slope of fEPSP were slower in 5XAFD mice than WT controls (*P < 0.05). All data are presented as the mean ± SEM (t-test for B–D, F–H or repeated-measures analysis of variance for A, E). *P < 0.05, vs. WT (mean ± SEM; Student’s t-test). WT: Wild-type; FAD: family Alzheimer’s disease; LTP: long-term potentiation; E-LTP: early-LTP; fEPSP: field excitatory postsynaptic potential; TBS: theta-burst stimulation; 5XTBS: 5 theta-burst stimulation.

