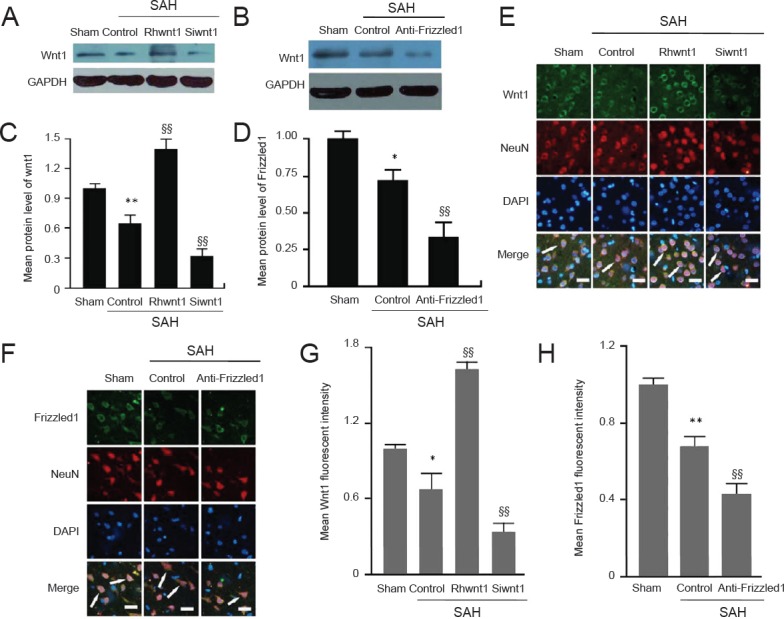
Figure 4.

Changes in Wnt1 and Frizzled1 expression altered by rhwnt1, siwnt1, and anti-Frizzled1 treatment after experimental SAH.
(A, B) Representative bands detected from western blots of Wnt1 (41 kDa) expression in sham, SAH + control, SAH + rhwnt1, and SAH + siwnt1 groups, and Frizzled1 (92 kDa) expression in sham, SAH + control, and SAH + anti-Frizzled1 groups. (C, D) Mean protein levels of wnt1 and Frizzled1 in the sham group were used as the standard. (E, F) Double immunofluorescence analysis by fluorescence microscopy with antibodies for Wnt1 and Frizzled1 (green) and neuronal marker (NeuN; red). Nuclei were fluorescently labeled with DAPI (blue). Arrows indicate Wnt1 and Frizzled1 immunoreactive cells in neurons. Scale bars: 32 μm. (G, H) Mean fluorescent intensity in the sham group was used as the standard. Data are shown as the mean ± SEM (n = 6; one-way analysis of variance followed by Scheffé F post hoc test). *P < 0.05, **P < 0.01, vs. sham group; §§P < 0.01, vs. SAH + control group. SAH: Subarachnoid hemorrhage; GAPDH: glyceraldehyde-3-phosphate dehydrogenase.
