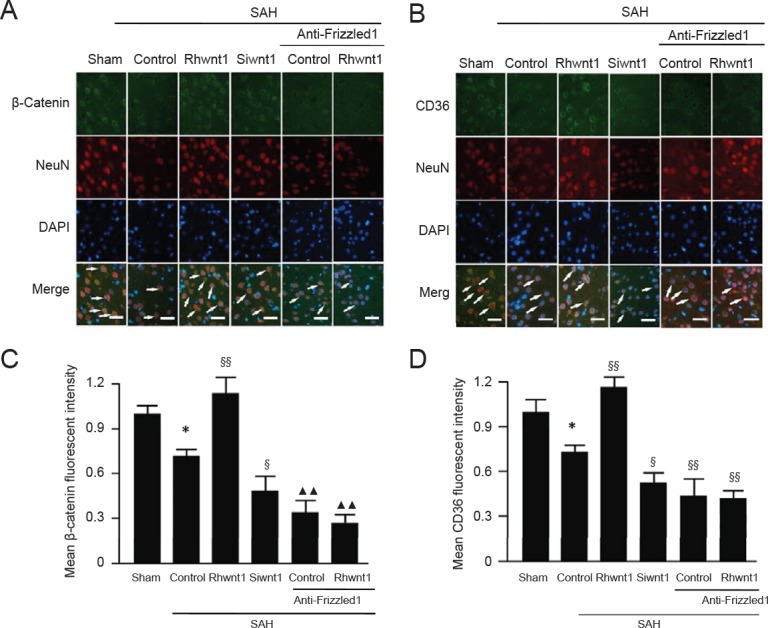
Figure 8.

Changes in β-catenin and CD36 following rhwnt1, siwnt1, and anti-Frizzled1 intervention after experimental SAH.
(A, B) Double immunofluorescence analysis by fluorescence microscopy (original magnification, 100×) with antibodies for β-catenin and CD36 (green) and neuronal marker (NeuN; red). Nuclei were fluorescently labeled with DAPI (blue). Arrows indicate β-catenin and CD36 immunoreactive neurons. Scale bars: 32 μm. (C, D) Mean fluorescent intensity in the sham group was used as the standard. Data are shown as the mean ± SEM (n = 6; one-way analysis of variance followed by Scheffé F post hoc test). *P < 0.05, vs. sham group; §P < 0.05, §§P < 0.01, vs. SAH + control group; ▴▴P < 0.01, vs. SAH + siwnt1 group. SAH: Subarachnoid hemorrhage; DAPI: 4′,6-diamidino-2-phenylindole.
